Hello, this is Next Invest ㅎ
In addition to the previous portfolio analysis service, this time I've added a stock price simulator service
Stock price simulation cannot be considered a prediction; it's a price simulation using Monte Carlo simulation which is used in time series simulations and such
You can think of it as creating simulation paths using a stock's past returns, consensus future returns, past price volatility, and stock characteristics, etc.
Therefore, it would be better to view it as a price range guide through simulation rather than as a future return prediction path.
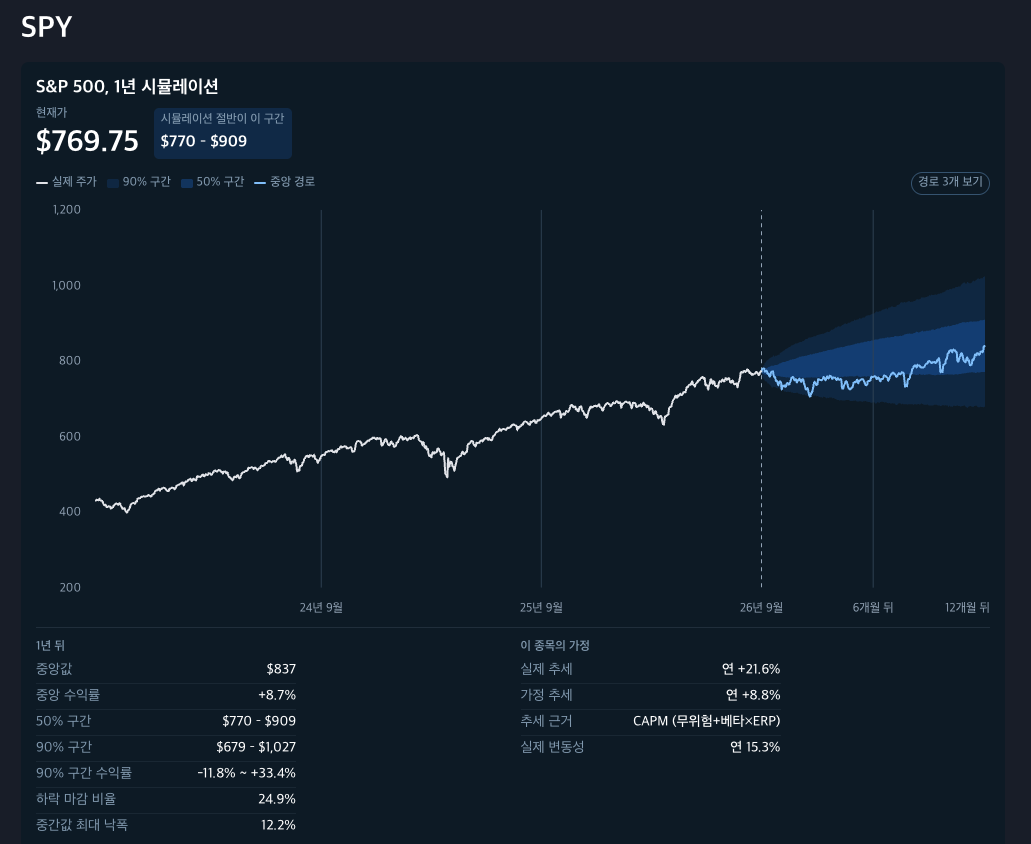
1. First, here's how S&P 500 comes out; it certainly has relatively small volatility. The darkly shaded part of the band is the 50% range, and the slightly lighter shaded part is the 90% price range.
You can interpret the simulation results as about 50% of the price paths one year later falling within that dark range. The line is a price simulation path that falls exactly at the median value.
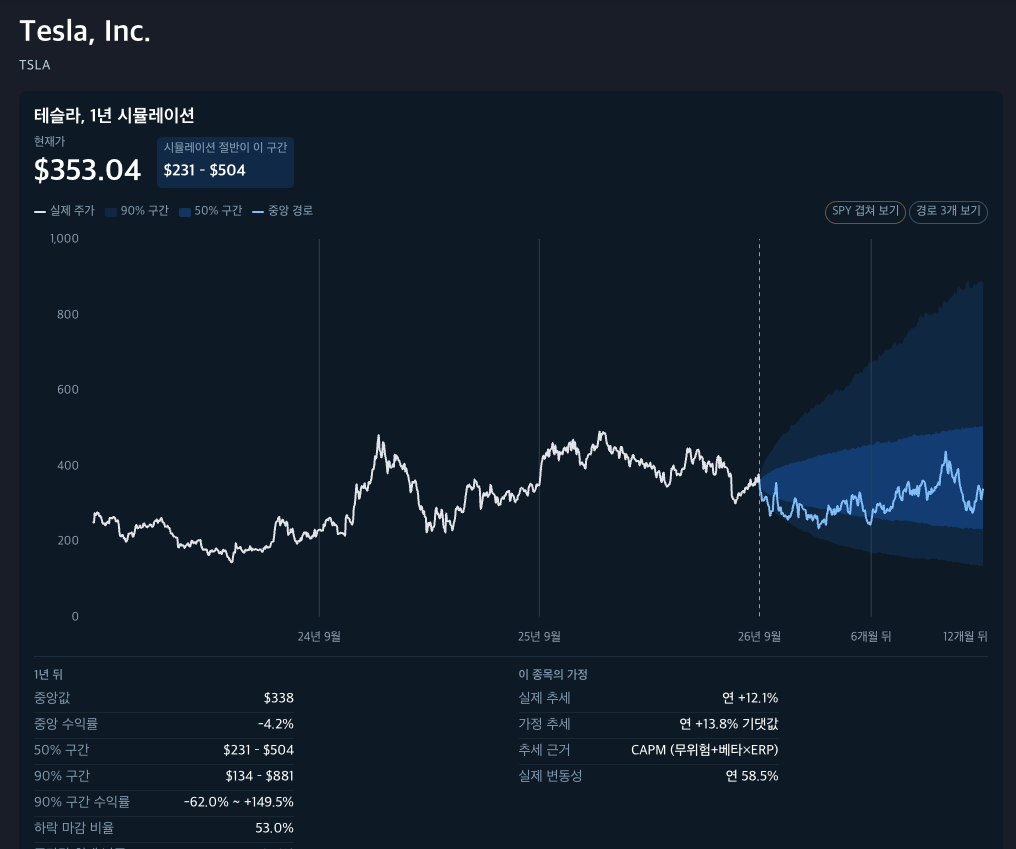
2. Next, when you look at highly volatile stocks like Tesla, the simulated price range is certainly extremely wide. And as a risky stock, the average return is high, but it appears that way because the upside is open-ended. It's a picture where a small number of so-called jackpot scenarios pull up the overall return. On the other hand, the median return is low. It well reflects the characteristics of these types of stocks
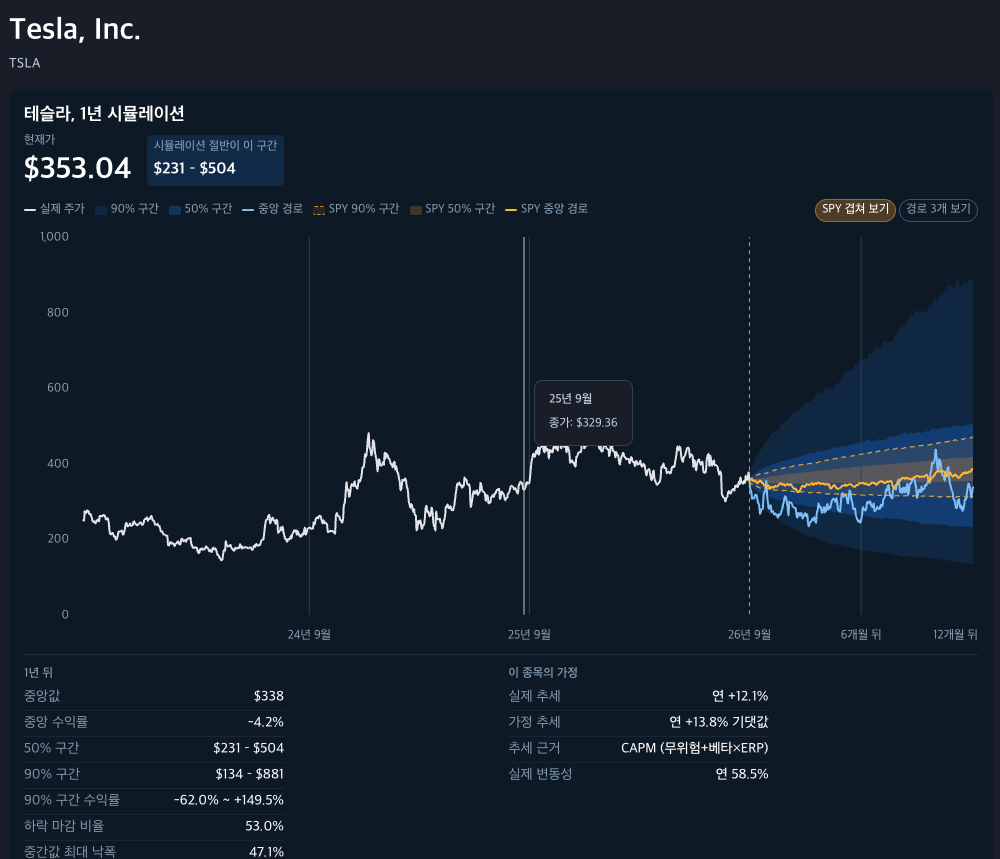
Comparison with S&P500 is also possible. You can see at a glance that it has high volatility and the simulated price range is much wider accordingly. The yellow band is the price band corresponding to SPY.
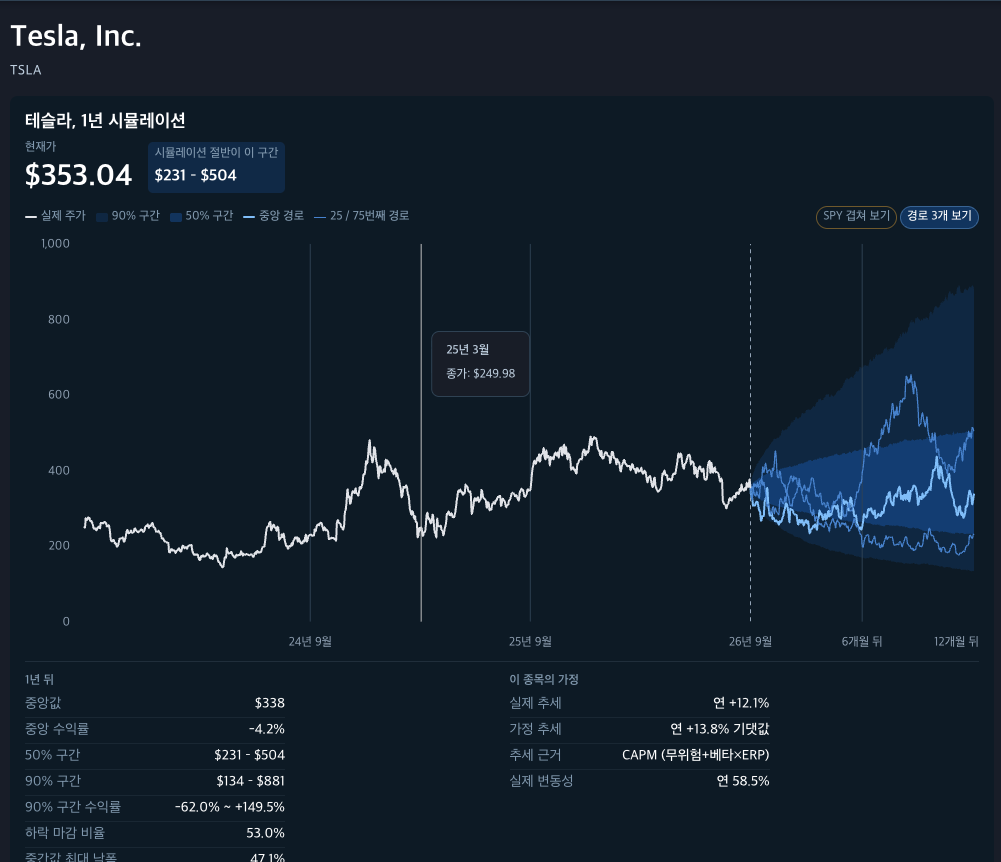
In addition to the median price path, you can also see paths corresponding to the 25th and 75th percentiles.
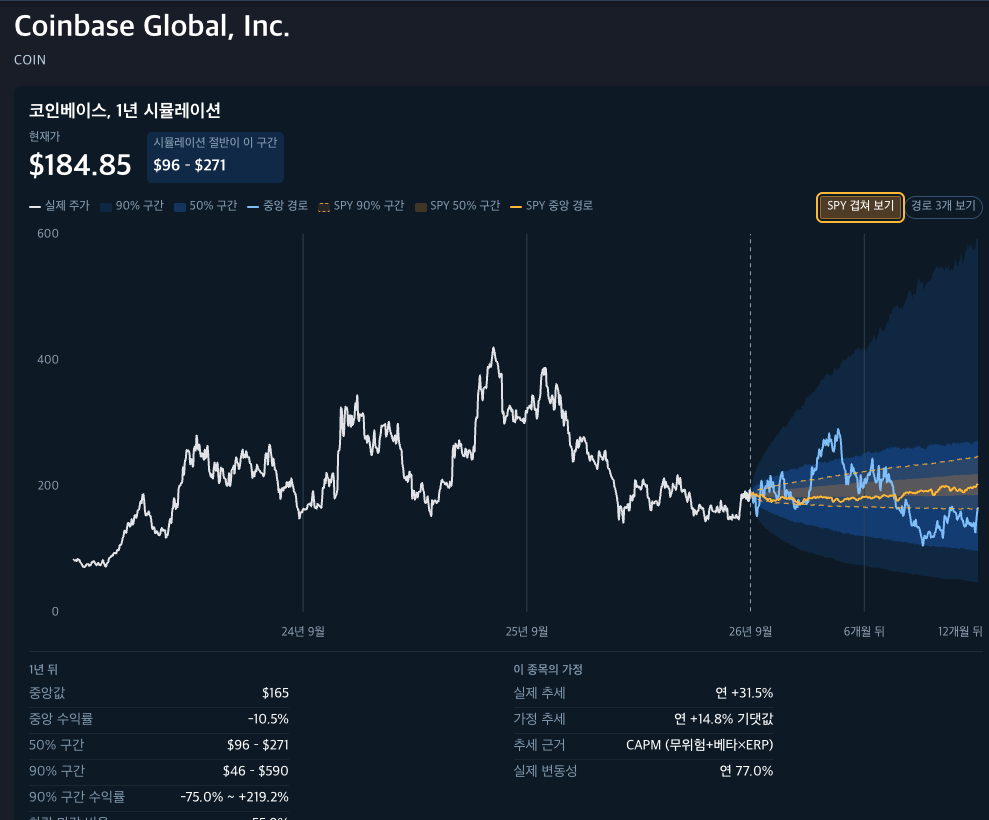
3. Coinbase has extremely poor volatility and its median return is also lower than S&P500. But the average return is much higher. See how the 90% band spreads widely upward? The huge returns when there's a jackpot pull up the average return. This is what a so-called jackpot-targeting stock looks like. Many people think of average returns as if they were realized returns... but this is the trap of averages, isn't it.. ㅎ
4. SK Hynix also comes out as a jackpot/gamble stock ㅠㅠㅠ
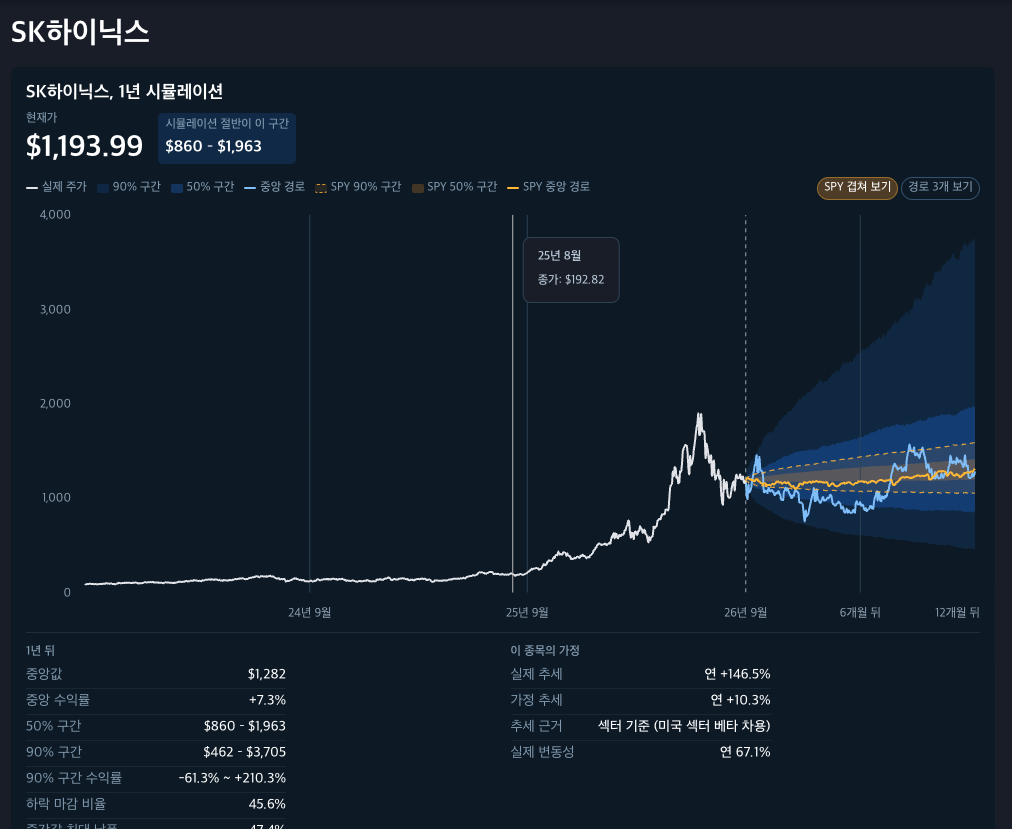
As mentioned at the beginning, the data shown is only the result of simulated calculations, not a prediction of the future. You must keep this in mind.
I created it because it seems to be a fairly helpful simulation in terms of showing the risk/volatility and profit/loss probabilities of stocks you want to invest in.
Next time, I'm thinking of also adding this simulation analysis path to the portfolio analysis I created previously ㅎ
Anyone interested is welcome to try it out comfortably, and feedback is always welcome ㅎ
Source: www.nextinvest.org/ko?source=damoang

