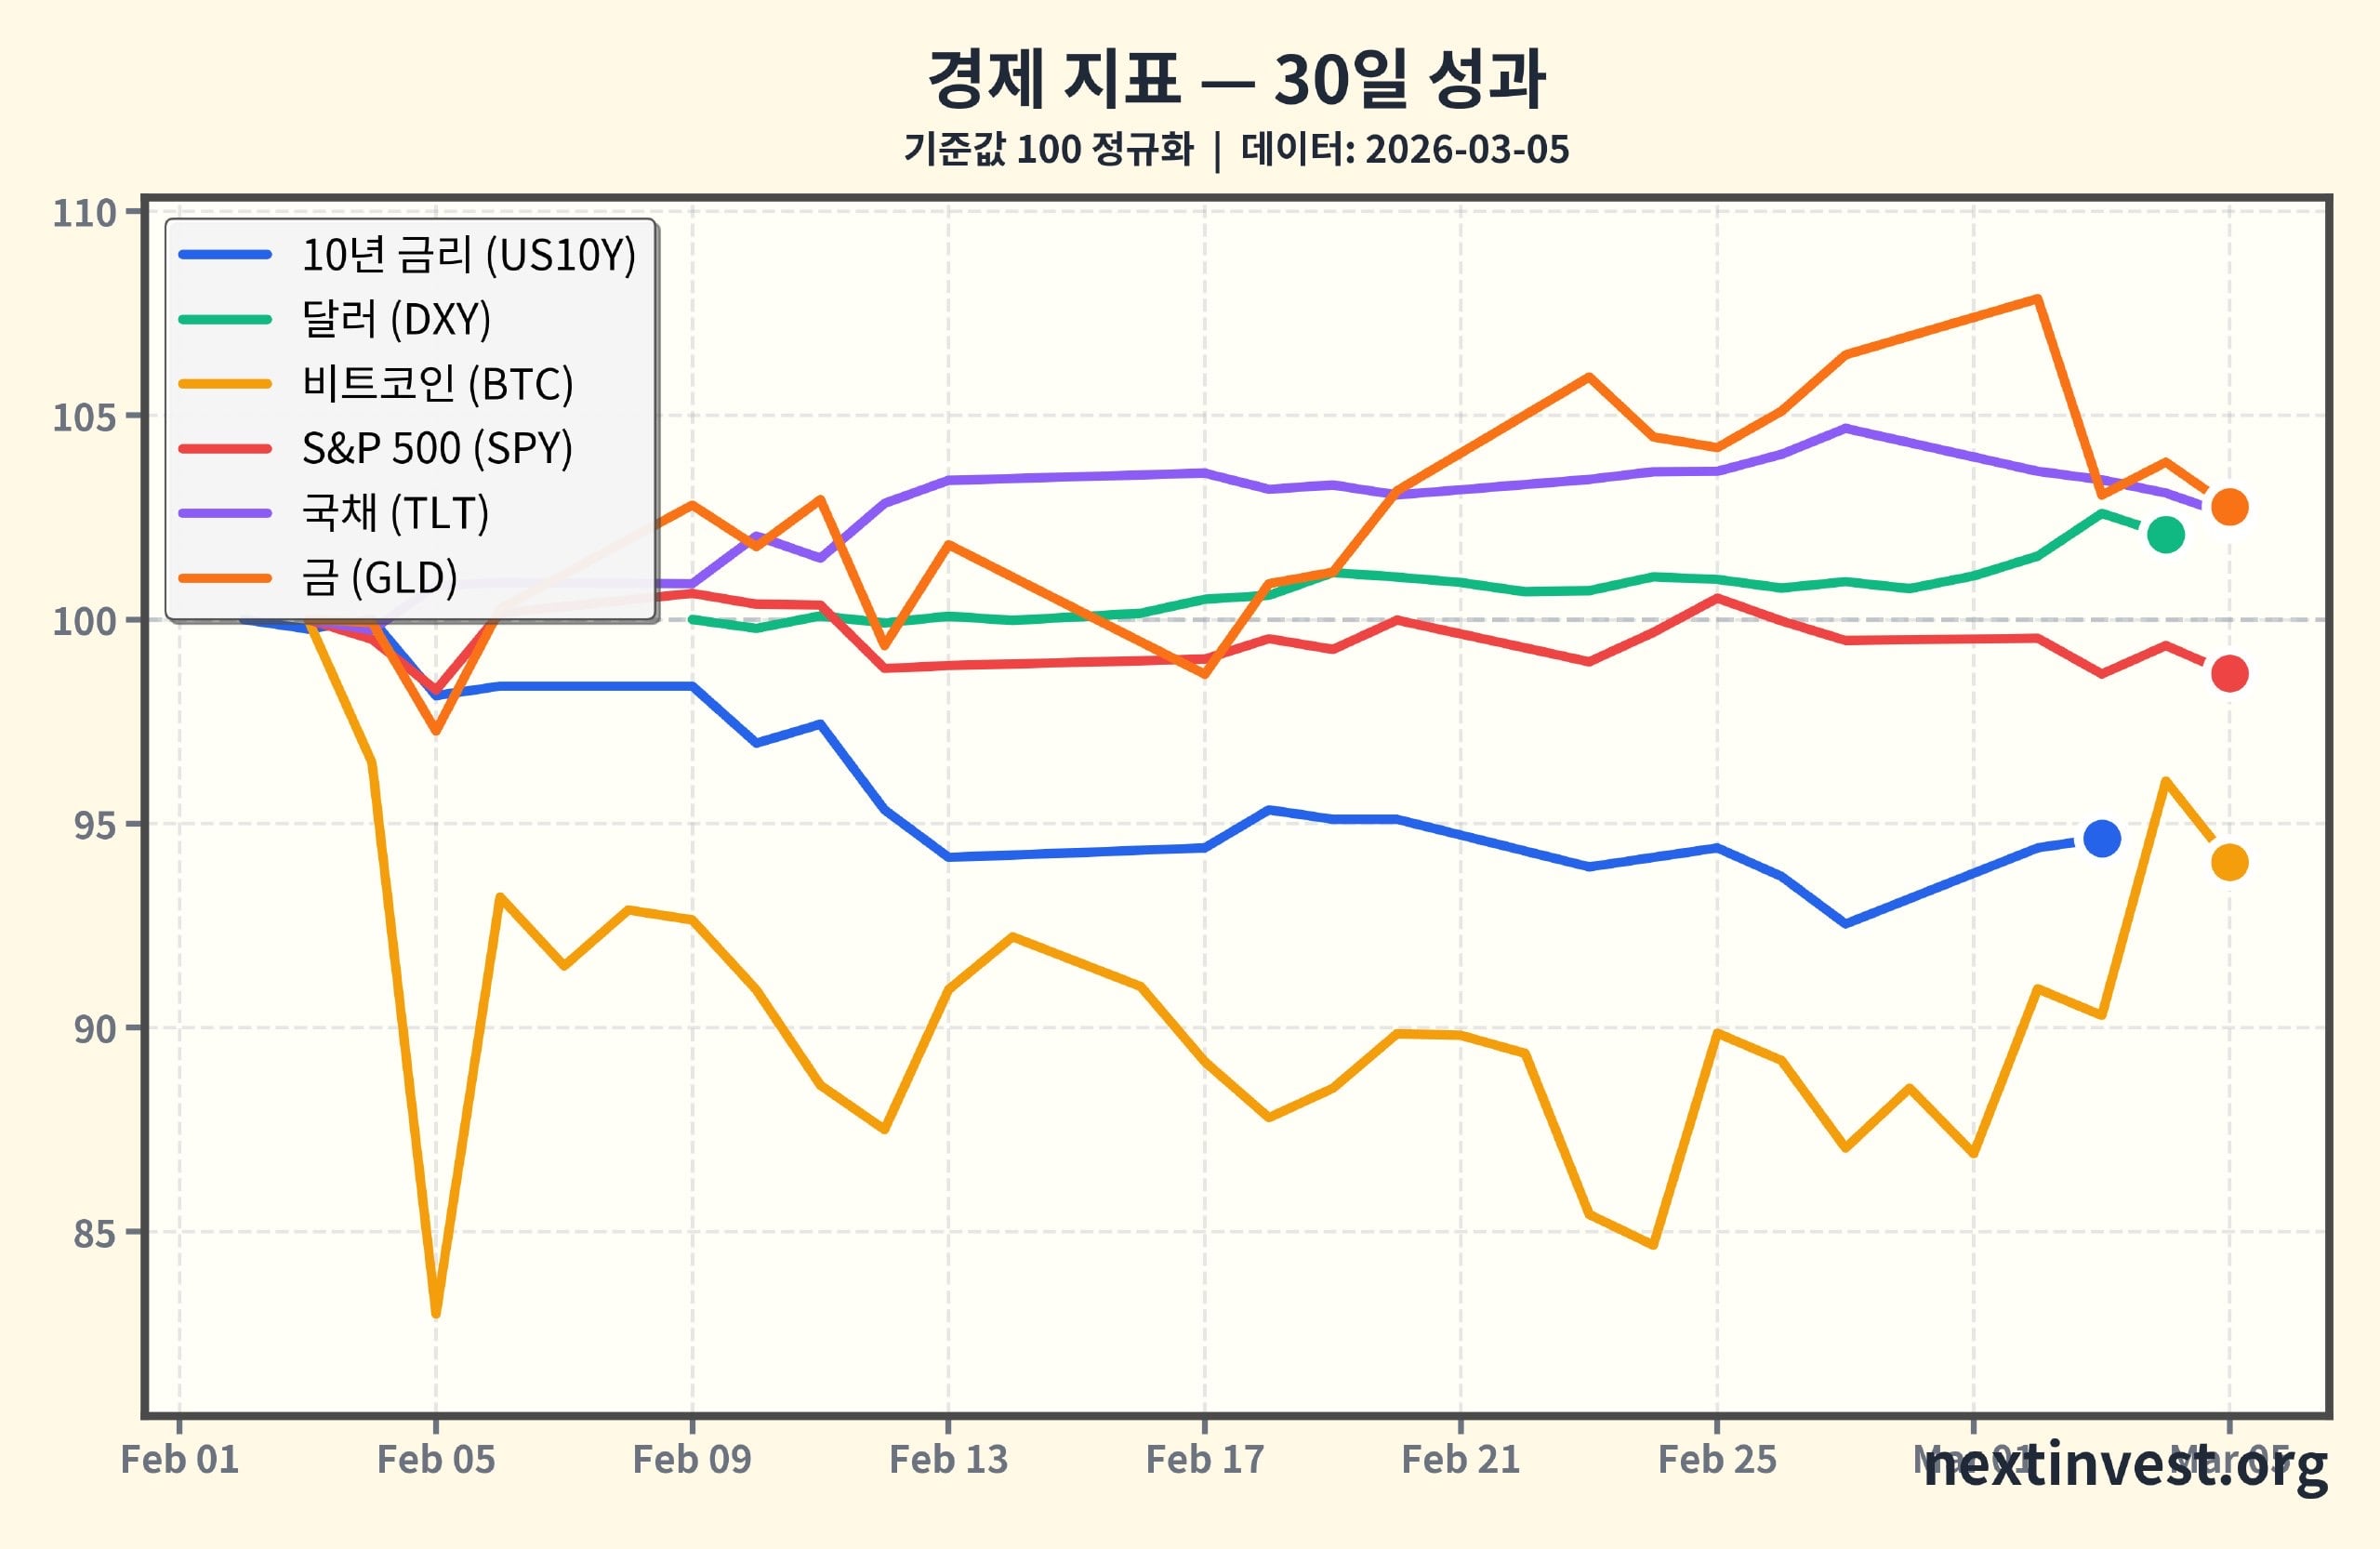
3/5 Asset Markets — Oil Prices Surge Again, Crypto Holds Steady
# March 05, 2026 Daily Macro Market Report
## Today at a Glance
As the Iran war and Strait of Hormuz crisis continue, oil prices surged again, sending U.S. Treasury yields higher, stocks lower, and Bitcoin into a holding pattern.
- 10-Year U.S. Treasury Yield: approximately 4.06%, slightly up from the previous day (data: +0.25%) — back above the low 4% range. (energynews.oedigital.com)
→ 10-Year Yield: The interest rate the U.S. pays to borrow money for 10 years; it serves as the benchmark rate for financial assets worldwide.
- U.S. Stock ETFs: S&P 500 (SPY -0.68%), Nasdaq 100 (QQQ -0.44%), Dow (DIA -1.73%) all declined — the Dow fell the hardest, particularly sensitive to energy and inflation pressures.
- Crude Oil ETF USO: surged +4.11% in a single day, approaching nearly +20% over 7 days — driven by supply disruption fears from the Iran war and Strait of Hormuz risk. (angle360ng.com)
- Bitcoin: approximately $71,185 per data, a daily correction of around -2%, but has been holding firmly above $70,000 for the past several days. (ainvest.com)
- Dollar Index (DXY): 98.93, down -0.5% on the day — safe-haven demand is spreading to Treasuries, gold, and partly Bitcoin, giving the dollar a brief pause in its strength.
Key one-line summary:
> "War-driven oil price shock → inflation and rate pressures reignited → stocks weaken, Bitcoin and commodities hold their ground"
---
## 1. Oil Price Surge: War Brings Inflation Back
The biggest story today is oil.
- Crude oil ETF USO rose +4.11% in a single day, +19.5% over the past 7 days, and +23% over 30 days.
- In the physical market as well, Brent crude jumped above $84 per barrel, up nearly 20% in a week. (globecapital.com)
- The backdrop is the U.S.-Israel vs. Iran war and the Strait of Hormuz crisis. About 20% of the world's oil passes through this strait, so any threat of blockage triggers a supply shock. (en.wikipedia.org)
> Simply put: Oil is like the "lifeblood" of the global economy, so even just the growing risk of a major transit route being blocked is enough to send prices spiking.
### Why Does This Matter?
- Rising oil prices → higher logistics and production costs → renewed upward pressure on inflation.
- For consumers and businesses already exhausted by high prices, the fear of another oil-driven inflation wave is growing.
- For the central bank (Fed), this makes it harder to rush into rate cuts. Moving too fast could trigger an oil-fueled price explosion.
> In everyday terms: gasoline, airfare, and delivery fees could get expensive again — and that can ripple through to food and service prices as well.
---
## 2. Interest Rates: 10-Year Back Above 4%, Markets in "Tension Mode"
When oil rises, the next thing to watch is Treasury yields — especially the 10-year.
- Today the 10-year U.S. Treasury yield was around 4.06% (in some spot markets it climbed intraday to the 4.1% range), up +0.25% on the day per data. (energynews.oedigital.com)
- The real yield (10-year TIPS real yield) also rose to 1.77%, up +0.57% on the day.
- Real yield: The "true" interest rate after stripping out inflation. Think of it as what actually remains of bank interest after subtracting the rate of price increases.
- The 10-year/2-year yield spread (yield curve) widened slightly to 0.55%.
- Yield curve: A line connecting short- and long-term interest rates. When long-term rates are sufficiently higher than short-term rates, it signals that markets expect stronger future growth and inflation.
### The Relationship Between Interest Rates and Bond Prices
- Bond prices and interest rates move like a seesaw.
→ When rates rise, existing bonds become less attractive, so bond prices fall.
- That is why TLT, the long-term Treasury ETF (20+ years), fell -0.53% today.
### Why Does This Matter?
1. Loan and mortgage rates: When the 10-year yield rises, mortgages, corporate bonds, and student loans tend to be pulled higher along with it.
2. Higher "discount rate" for stocks:
- Stock valuations are calculated by discounting future earnings back to today's value.
- Treasury yields are the benchmark used for this — when they rise, even the same level of earnings produces a lower theoretical stock value.
3. Growth stocks vs. value stocks:
- Growth and tech stocks (Nasdaq) — which have a larger share of earnings far in the future — are especially sensitive to rising rates.
> Today followed the classic pattern: "oil-driven inflation fears → modest rate rise → broad pressure on equities."
---
## 3. Stock Market: The Dow Took the Hardest Hit
Today's U.S. stock ETF moves reveal a "weakness centered on traditional industrials that dislike oil and rate shocks."
- S&P 500 ETF (SPY): -0.68% (7-day -1.29%, 30-day -1.32%)
- Nasdaq 100 ETF (QQQ): -0.44% (7-day -0.19%)
- Dow ETF (DIA): -1.73% (7-day -3.14%)
According to major news sources, by the close today the Dow and the Russell 2000 — traditional and small-cap indexes — fell harder, while some AI and tech names continued to hold up. (thestreet.com)
> By analogy: when an oil-and-rate bomb goes off, the sectors most directly tied to the real economy — energy, industrials, consumer goods — take the first hit, while tech stocks with strong growth stories have somewhat thicker armor.
### Why Did the Dow Fall More?
- Companies in the Dow index skew heavily toward energy, industrials, financials, and consumer goods — sectors close to the real economy.
- Rising oil means higher input costs; rising rates mean higher borrowing costs.
- On top of that, volatility has been elevated since the sharp U.S. market drop in January, so investors are primed to "sell first and ask questions later" at the first sign of bad news. (en.wikipedia.org)
### What Does This Mean for Individual Investors?
- In the short term, higher exposure to economically sensitive or small-cap stocks means greater volatility risk.
- In the long term, what matters is where oil and interest rates stabilize. If both keep rising together, earnings will compress and valuations (price levels) will need to reset.
---
## 4. Bitcoin: A Digital Asset "Holding Its Ground" Amid Rising Oil and Falling Stocks
Per data, Bitcoin is at $71,185 (-2.06%), a modest pullback — but looking at the physical and derivatives markets, there is a fierce battle for support in the $70,000–$73,000 range. (ainvest.com)
- Over the past several days, Bitcoin has tested the low $70,000s multiple times yet managed to recover each time.
- On-chain and derivatives data still show high volatility, but many analysts say ETF inflows and institutional demand are acting as a floor. (cryptoslate.com)
> Simply put: even as stocks wobble, Bitcoin is not easily breaking down thanks to the narrative that it is a hedge against inflation and war risk.
### Key Points for Interpreting Today's Bitcoin Move
1. Inflation and war hedge:
- When major risks like an oil spike and a war hit simultaneously, some capital moves toward assets independent of government control.
- Bitcoin is sharing part of that role alongside precious metals like gold and silver.
2. Volatility remains high:
- Over 90 days, Bitcoin pulled back more than -20% before recovering back above $70,000.
- In other words, "holding its ground" is a relative term — it remains a high-risk asset that can move several percent in a single day.
### What Does This Mean for Individual Investors?
- There may be diversification benefits relative to stocks, bonds, and commodities —
- but managing the size of your position in your portfolio is more important than anything else. Determine in advance what level of volatility and what investment horizon you can actually handle.
---
## 5. Gold and Silver: "Safe Havens That Are No Longer as Simple as They Used to Be" Amid the Energy Shock
Today's precious metals ETF moves are somewhat mixed.
- Gold ETF (GLD): -1.05% (but up +20.8% over 90 days — a significant rally)
- Silver ETF (SLV): -1.09% (pausing after a powerful +40.74% rally over 90 days)
> Summary: After climbing sharply over the past three months through war, political risk, and market turbulence, gold and silver are taking what looks more like a breather today.
### Why Are They Moving This Way?
- Looking only at oil prices and war headlines, gold should be rising further —
- but in practice, dollars, Treasuries, and even Bitcoin are all competing simultaneously as "safe-haven candidates."
- Short-term position adjustments (profit-taking) can send gold and silver lower for a day.
### Points for Individual Investors
- These assets have already risen 20–40% in three months, so this can also be read as a signal to review your allocation rather than chase the rally.
---
## 6. Today's Connecting Thread
The keyword linking today's markets is: "War → oil price surge → inflation and rate pressure → stocks weaken, Bitcoin and commodities hold."
1. War and Hormuz risk push oil higher. (en.wikipedia.org)
2. Surging oil fuels fear that inflation could re-accelerate.
3. Inflation concerns feed into rising Treasury yields and expectations of a delayed Fed rate cut. (energynews.oedigital.com)
4. Rising rates weigh on stocks — especially economically sensitive and traditional industrial names. (thestreet.com)
5. Meanwhile, some capital rotates into alternative assets like Bitcoin, gold, and silver, helping those assets hold up relatively better.
> Summary sentence:
> "When energy markets shake, the tremors run straight through inflation, rates, stocks, and crypto" — today was a day when that textbook pattern played out exactly as written.
---
## Wrap-Up: A Checklist for Individual Investors Right Now
1. Oil Price Chart
- Watch where USO and Brent/WTI spot prices stabilize.
- If oil keeps climbing, you should factor in re-heating inflation and delayed rate cuts.
2. 10-Year Yield Level
- Is it pushing further above the low 4% range, or pulling back below 4%?
- This is directly tied to mortgage and consumer loan rates, so real estate and leveraged investors in particular need to watch it closely.
3. Energy and Alternative Asset Allocation in Your Portfolio
- Check whether your exposure to energy-related stocks/ETFs, gold, silver, and Bitcoin is too concentrated in one direction.
- In a "war market," gains can come fast — but when conditions ease, the reversal can be just as swift.
4. Upcoming Data and Events
- Depending on how upcoming U.S. employment and inflation reports — and Fed commentary — are interpreted in light of today's rate and oil moves, asset prices could swing sharply again.
---
This report is general information for educational purposes only and does not constitute a recommendation to buy or sell any specific asset. All investment decisions and their consequences are entirely the responsibility of the individual investor.
This content has been prepared for informational purposes only and does not constitute a solicitation to invest in any specific stock or asset.
Source: https://nextinvest.org/ko