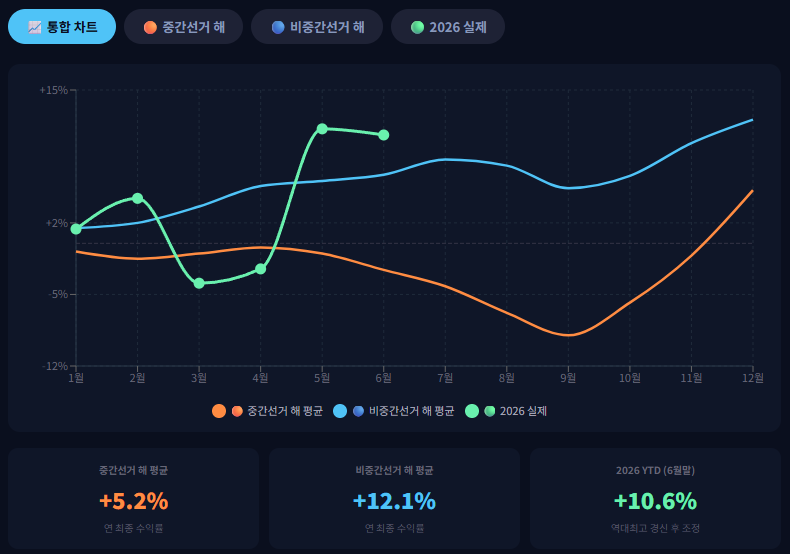
For reference, please consider this a graph showing the monthly seasonality of the US SPX.
It's a graph of the monthly cumulative return rate for the US SPX in years with midterm elections, years without midterm elections, and this year. There is a common point. It means that adjustments will be made from August, hitting a low in September, and then rebounding in the second half.
It seems likely to decline after the July earnings announcement and hit a low in September before rising until the midterm elections. Trump is expected to stage a comeback show somehow until the midterm elections.