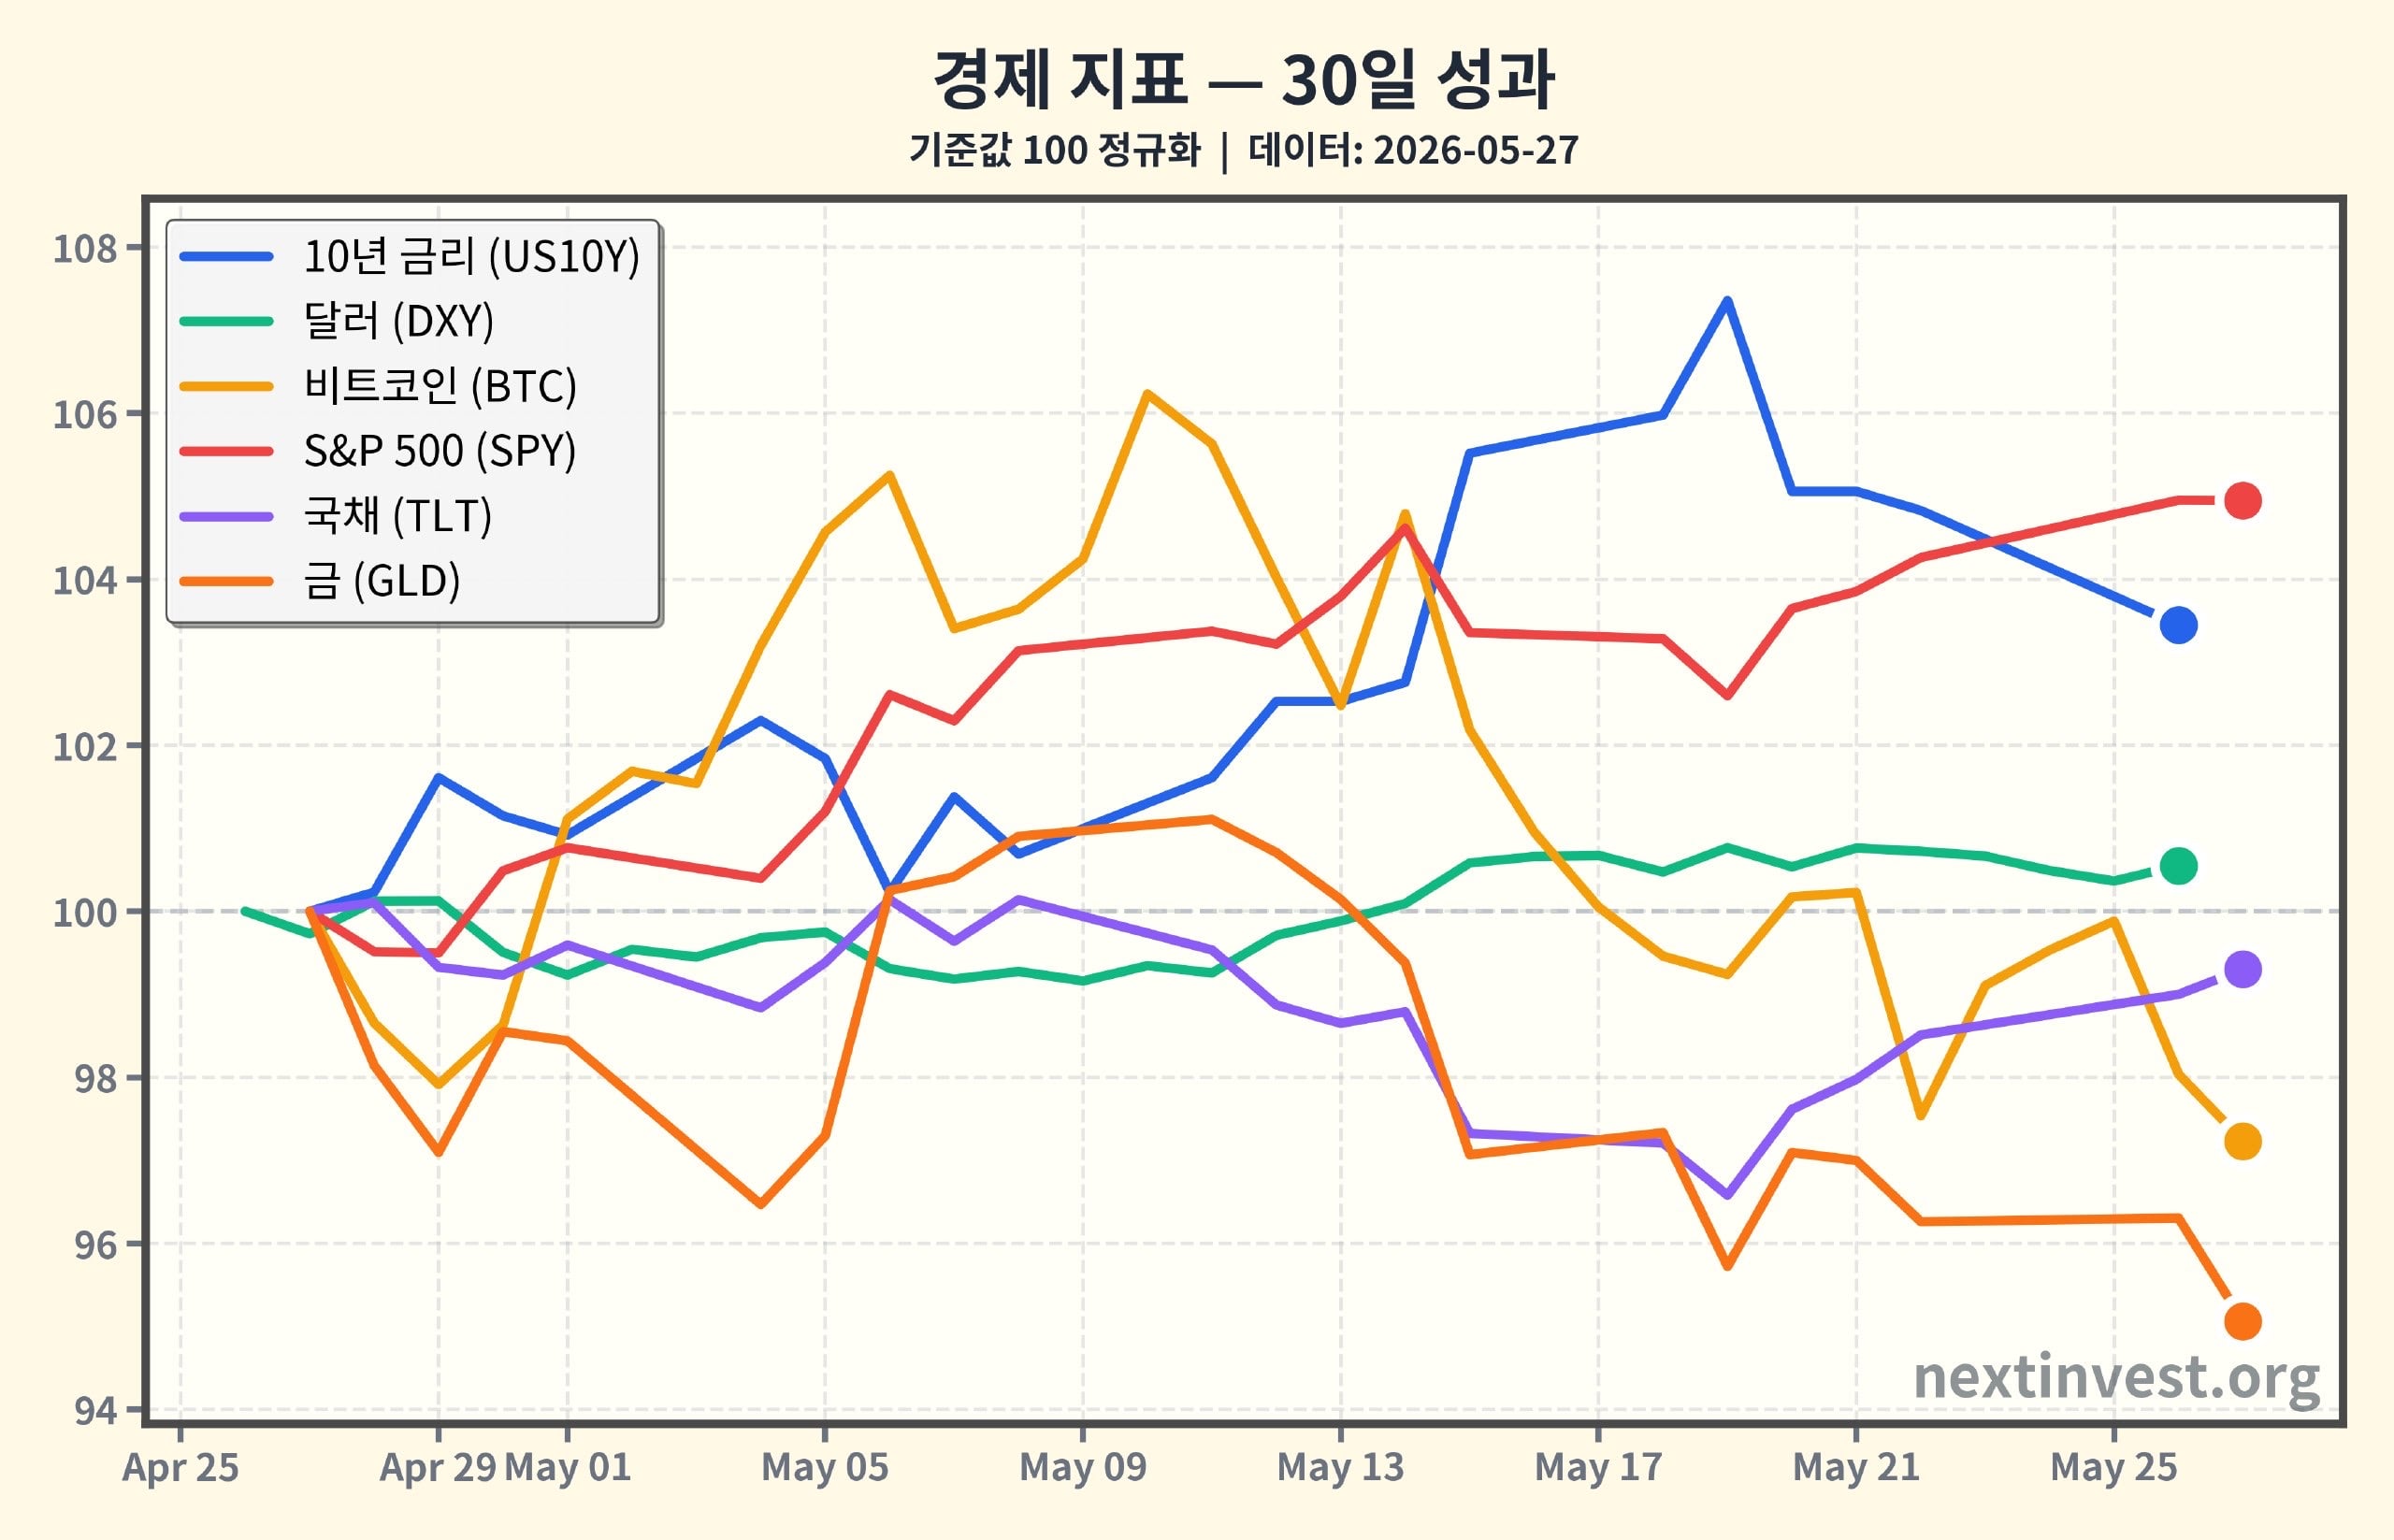
5/27 Asset Markets - Stock Market Hits Record High on Oil Plunge, Bitcoin Shaken by ETF Selling
May 27, 2026 Macroeconomic Daily Market Report
## 1. Today's Market at a Glance
Today (US Eastern Time, May 27), the US market was a day of simultaneous oil plunge + slight rate decline + stock market reaching new record highs + Bitcoin weakness.
- US 10-Year Treasury Yield: 4.50% (1 day -1.32%)
- 10-Year Real Interest Rate (TIPS): 2.10% (1 day -2.78%)
→ "Real" interest rates are inflation-adjusted rates, which can be understood as closer to the actual interest returns investors actually experience.
- US Dollar Index (DXY): 99.18 (1 day +0.19%)
→ The dollar index is an indicator that shows how strong the dollar is relative to a basket of major currency pairs.
- Oil Price ETF (USO): 131.03 (1 day -4.36%)
- Bitcoin: $75,228 (1 day -0.82%)
- S&P 500 ETF (SPY): 750.56 (1 day nearly flat, stock index slightly renews all-time high) (apnews.com)
To summarize:
- Oil prices fell sharply due to easing Middle East tensions and expectations of Strait of Hormuz reopening,
- Bond rates dipped slightly, creating a favorable environment for the stock market,
- The stock market continued its march toward all-time highs, but
- Bitcoin is wavering near $75,000 due to large ETF selling and capital outflows. (coinmarketcap.com)
From an investor's perspective, it was a day that could be seen as "commodities and stocks relatively stable, crypto in a period of expanded volatility."
---
## 2. Bonds and Rates: Long-Term Rates Fall, But Big Picture Still Maintains High-Rate Environment
### 2-1. Today's Rate Movements
- 10-Year Treasury Rate: Closed at 4.50%, -1.32% versus previous day (yield basis), declining about 0.06 percentage points in absolute terms
- 10-Year Real Interest Rate (TIPS): 2.10%, 1 day -2.78%
- 10Y-2Y Rate Spread (Yield Curve): 0.49%, 1 day +13.95%
Here, the yield curve (10Y-2Y spread) is the value of subtracting the 2-year rate from the 10-year rate.
- The larger the positive value → the higher long-term rates are compared to short-term rates, which is typically interpreted as a signal that economic outlook is relatively not bad.
Today's 10-year rate dipped slightly, but it has risen 11% over the past 90 days.
Real rates have also risen more than 18% over three months. → This means it was a quite challenging environment for bond investors over the past quarter.
### 2-2. What About Long-Term Trends?
Looking at structural (5-year) trends:
- Fed Funds Rate: Gradual declining trend since January 2024 (5.33% → 3.64%, approximately -32%)
- 10-Year Rate: Declined only slightly to 4.49% since October 2023 peak (4.8%), maintaining high-rate territory long-term
- 10-Year Real Rate: Declined slightly from 2.2% in November 2023 to 2.03%, but still in the positive 2% range
What does this mean for investors?
1. Looking at just today: Rates declining slightly is + for stocks, and brings a bit of relief for bond prices.
2. But in the big picture: The benchmark rate is declining, but long-term rates and real rates remain at elevated levels.
- A high discount rate must be applied to future cash flows (growth stocks, tech stocks, etc.), so growth stocks that have already seen their valuations (stock price levels) rise substantially may continue to experience high volatility.
3. The fact that the yield curve has returned to positive (steepening) means,
- Whereas the previous warning of "inverted curve → recession" eases instead,
- It can also be read as a signal that "growth and inflation may remain quite elevated for an extended period."
For investors looking to increase bond allocation,
- A more realistic perception is "still at elevated rates, but the near-term peak may have passed" rather than "rates have fallen significantly."
---
## 3. Oil Plunge: Middle East Risk Easing as Today's Key Catalyst
### 3-1. What Happened to Oil Prices Today?
- Oil Price ETF (USO): 1 day -4.36%
- In actual spot markets too,
- Brent crude fell about -4.6% to $92.25 per barrel,
- US WTI crude plummeted -5.5% to around $88.68. (apnews.com)
There are two main reasons.
1. US-Iran Tension Easing and Ceasefire Maintenance
- Tensions between the US and Iran have somewhat eased, reducing concerns about full-scale conflict and supply disruptions that had been recent surge factors. (apnews.com)
2. Expectations of Strait of Hormuz Reopening
- With reports from Iran suggesting the Strait of Hormuz could reopen within about a month,
- Expectations that the "chokehold" on crude oil transport could be loosened again have been reflected in prices. (international.schwab.com)
As oil prices fell, stock prices of companies with high fuel costs such as airlines and cruises surged in the US stock market.
- Norwegian Cruise Line +6.1%
- United Airlines +6.3%
- Delta Air Lines +3% (all-time high) (apnews.com)
### 3-2. What Does This Mean for Investors?
1. Easing Cost Burden on Households and Businesses
- Oil prices are directly linked to global inflation and corporate profits.
- The sharp decline in oil prices could reduce some inflation pressure going forward and lead to margin improvements in fuel-sensitive industries such as aviation, transportation, travel, and chemicals.
2. Taking a breath regarding inflation and central bank policy
- While CPI and Core PCE have continued to rise in recent months (each reversing upward again since entering 2026),
- When oil prices fall sharply like today, there is room for inflation figures in the coming months to come in more moderate than expected.
- This could serve as material to slightly ease the current delicate situation of "we won't raise rates further, but won't lower them easily either."
3. For energy and commodity investors
- In the short term, the risk of price adjustment has increased.
- However, on a 90-day year-to-date basis, USO is up +64%, still carrying significant gains,
The key is distinguishing whether this is "the first major pullback after a long-term rally or the beginning of a trend reversal."
---
## 4. Stock market: "Quiet new highs" boosted by oil prices
Today, major U.S. indices didn't rally significantly, but all succeeded in setting all-time record highs.
- S&P 500: Up less than +0.1%, setting new all-time highs
- Dow Jones: Up +0.4%
- Nasdaq: Up +0.1% (apnews.com)
On an ETF basis:
- SPY: 750.56 (1-day flat, 7-day +1.26%, 30-day +4.95%, 90-day +9.19%)
- QQQ: 729.76 (1-day -0.07%, but 30-day +9.87%, 90-day +19.93%)
- DIA: 507.10 (1-day +0.37%)
From a news perspective:
- Consumer-related companies such as Bath & Body Works and Abercrombie & Fitch reported better-than-expected earnings, showing strong stock performance. (apnews.com)
Interestingly, while consumer sentiment is becoming increasingly anxious about inflation, earnings remain quite solid. (apnews.com)
### What does this mean for investors?
1. A typical day of "bad news is good news"
- The chain reaction worked: news of easing Middle East tensions (= easing crude supply concerns) led to falling oil prices → expectations of easing inflation pressure → falling interest rates → bullish for stocks.
2. Growth and tech stock strength is still valid
- QQQ rising nearly 20% on a 90-day basis shows
that the market is still placing a high premium on AI and tech growth stories.
- However, with real rates in the low 2% range and 10-year yields around 4.5%, the environment is somewhat challenging for growth stock valuations to continue rising historically.
3. From a defensive perspective
- Prices (index levels) are at all-time highs,
- The policy rate is still in the mid-3% range, long-term and real rates are elevated,
- And unemployment is at 4.3% with a gentle upward trend (up since mid-2024).
→ It seems advantageous for risk management to interpret this as "momentum is strong, but safety margins are narrowing."
---
## 5. Bitcoin and crypto: The impact of large ETF sales and leverage liquidations
Today, Bitcoin fell to around the low 75,000 dollar level, declining about -0.8% on a 1-day basis.
### 5-1. Why did it fall?
Multiple sources commonly point to these three key factors:
1. Large sell block from BlackRock Bitcoin ETF (IBIT)
- On the morning of May 26, a block sell of approximately $1.28-1.29 billion (29 million shares) from BlackRock's iShares Bitcoin Trust (IBIT) was executed in dark pools, according to analysis. (coinmarketcap.com)
- Following this sale, Bitcoin's price quickly fell from around 78,000 dollars to the 75,000-dollar range between May 26-27.
2. Continued ETF outflows
- In recent days, net outflows (capital leaving) from Bitcoin spot ETFs have continued,
- This is being interpreted as a signal that institutional capital, which had been "the new big player in supply and demand," has re-entered a correction phase. (crypto.news)
3. Expanding leverage position liquidations
- During the price decline, forced liquidations of long (upside bet) positions occurred in a cascading manner.
- On May 27 alone, approximately $115 million in Bitcoin leverage positions were liquidated, and total crypto market liquidations exceeded $330 million. (news.bitcoin.com)
As a result, Bitcoin has declined about 9% from this year's high (around 82,000 dollars) and more than 40% from the previous cycle's peak (126,000 dollars), and some analysis suggests it has already entered a bear market territory (down more than -20% from the high) by traditional standards. (tradingnews.com)
### 5-2. Today's price movement and sentiment
- According to major on-chain and market reports,
- Bitcoin was trading in a 75,000-76,000 dollar range as of the morning of May 27,
- Short-term bounce attempts (around 77,000 dollars) were blocked by selling pressure and failed, according to observations. (coindesk.com)
- Some media outlets mentioned the possibility of a "bloodbath" and presented scenarios with an additional 40% decline (around $40,000). (forbes.com)
### What Does This Mean for Investors?
1. Crypto has transitioned to a typical "institutional buying/selling market"
- Rather than prices moving significantly based solely on retail investor buying and selling like in the past,
- The structure has changed to one where ETFs, futures, and institutional block trades (large transactions) dominate price movements.
- Therefore, it has become more important to check whether funds are actually flowing in or out, rather than focusing on "good news vs bad news."
2. A period where you should ask yourself whether you are ready to tolerate high volatility
- While the absolute price of $75,000 is higher than ever before,
- Considering that this is a -40% range from the cycle peak,
- there is a high likelihood that we are still in the mid-cycle period with large volatility swings.
3. In terms of correlation with traditional assets
- A combination like today where stocks hit record highs, interest rates decline, oil prices plunge, yet Bitcoin weakens,
- shows that Bitcoin does not move solely as "digital gold" or an "inflation hedge,"
- but rather confirms it remains a high-risk asset heavily influenced by separate supply/demand and psychological factors.
---
## 6. Dollar and Global Markets: Quiet Dollar, Limited Spillover Effects
- Dollar Index (DXY): 99.18 (1-day +0.19%, 7-day -0.21%, 30-day +0.55%)
- Emerging Markets ETF (VWO): 60.23 (1-day flat, 7-day +2.66%)
- Europe ETF (VGK): 89.32 (1-day -0.18%)
- Japan ETF (EWJ): 92.14 (1-day -0.82%)
The dollar index showed modest strength today, but the trend over the past month and three months has been very gradual.
Looking at the longer term:
- The DXY has declined approximately -8.6% from 108.49 at the end of 2024 to 99.15 in May 2026,
- representing a period where it has cooled somewhat from the strong dollar peak.
What this means for investors:
1. On a single-day basis today, dollar movements were not the main market story,
2. compared to "big stories" like oil, interest rates, and Bitcoin, it was a relatively quiet day.
3. However, in the long term, the strong dollar cycle appears to be peaking, and conditions for long-term diversified investment in emerging markets and foreign assets are gradually improving.
---
## 7. Wrapping Up Today: A Positioning Perspective Checklist
Finally, let me organize questions that investors should ask themselves after a day like today.
1. Is my portfolio benefiting from the sharp decline in oil prices?
- If I have zero exposure to fuel-sensitive sectors such as airlines, transportation, travel, and industrials,
- I may be missing opportunities in a period like now characterized by "falling oil prices + easing concerns about economic slowdown."
2. Is my allocation to growth stocks excessive in an environment where interest rates remain elevated?
- 10-year real rates in the 2% range and long-term rates in the 4.5% range
- represent fundamentally different conditions from the "zero interest rate era."
3. Is my crypto allocation within my volatility tolerance range?
- This is an asset that can move by several percentage points in a single day due to one ETF block trade or leverage liquidation.
- This is the time to double-check its allocation relative to your total assets.
4. Balance among cash, bonds, stocks, and alternative assets (real estate, commodities, crypto, etc.)
- Now is a regime where interest rates, inflation, and growth are all ambiguously elevated,
- so rather than going "all-in" on any single asset,
- a multi-layered portfolio structure that withstands different environments appears important.
---
## 8. Conclusion: A One-Line Summary of Today
> A sharp decline in oil prices briefly suppressed inflation and interest rate concerns, pushing stocks to new highs once again, while Bitcoin was shaken by ETF selling and leverage liquidations, clearly showing the temperature differential between risk assets.
This content has been prepared for informational purposes only and does not recommend investment in any specific stocks or assets.
Source: https://nextinvest.org/ko
Sharing without permission is welcome ^^