6/5 Weekly Summary - Surprise Employment Numbers Rekindle Rate Hike Concerns, AI and Cryptocurrencies Plunge Together in One Week
# June 05, 2026 Macroeconomic Weekly Market Report
## This Week's Core Theme: "Employment is Hot, But What About Interest Rates?"
The one sentence that moved this week's market is this: "Employment is so strong that the Federal Reserve actually finds it harder to cut rates further."
- In May's U.S. employment report, non-farm job additions came in at nearly double market expectations (over 170,000), and concerns that "might rates be raised again?" have overshadowed worries about economic slowdown. (apnews.com)
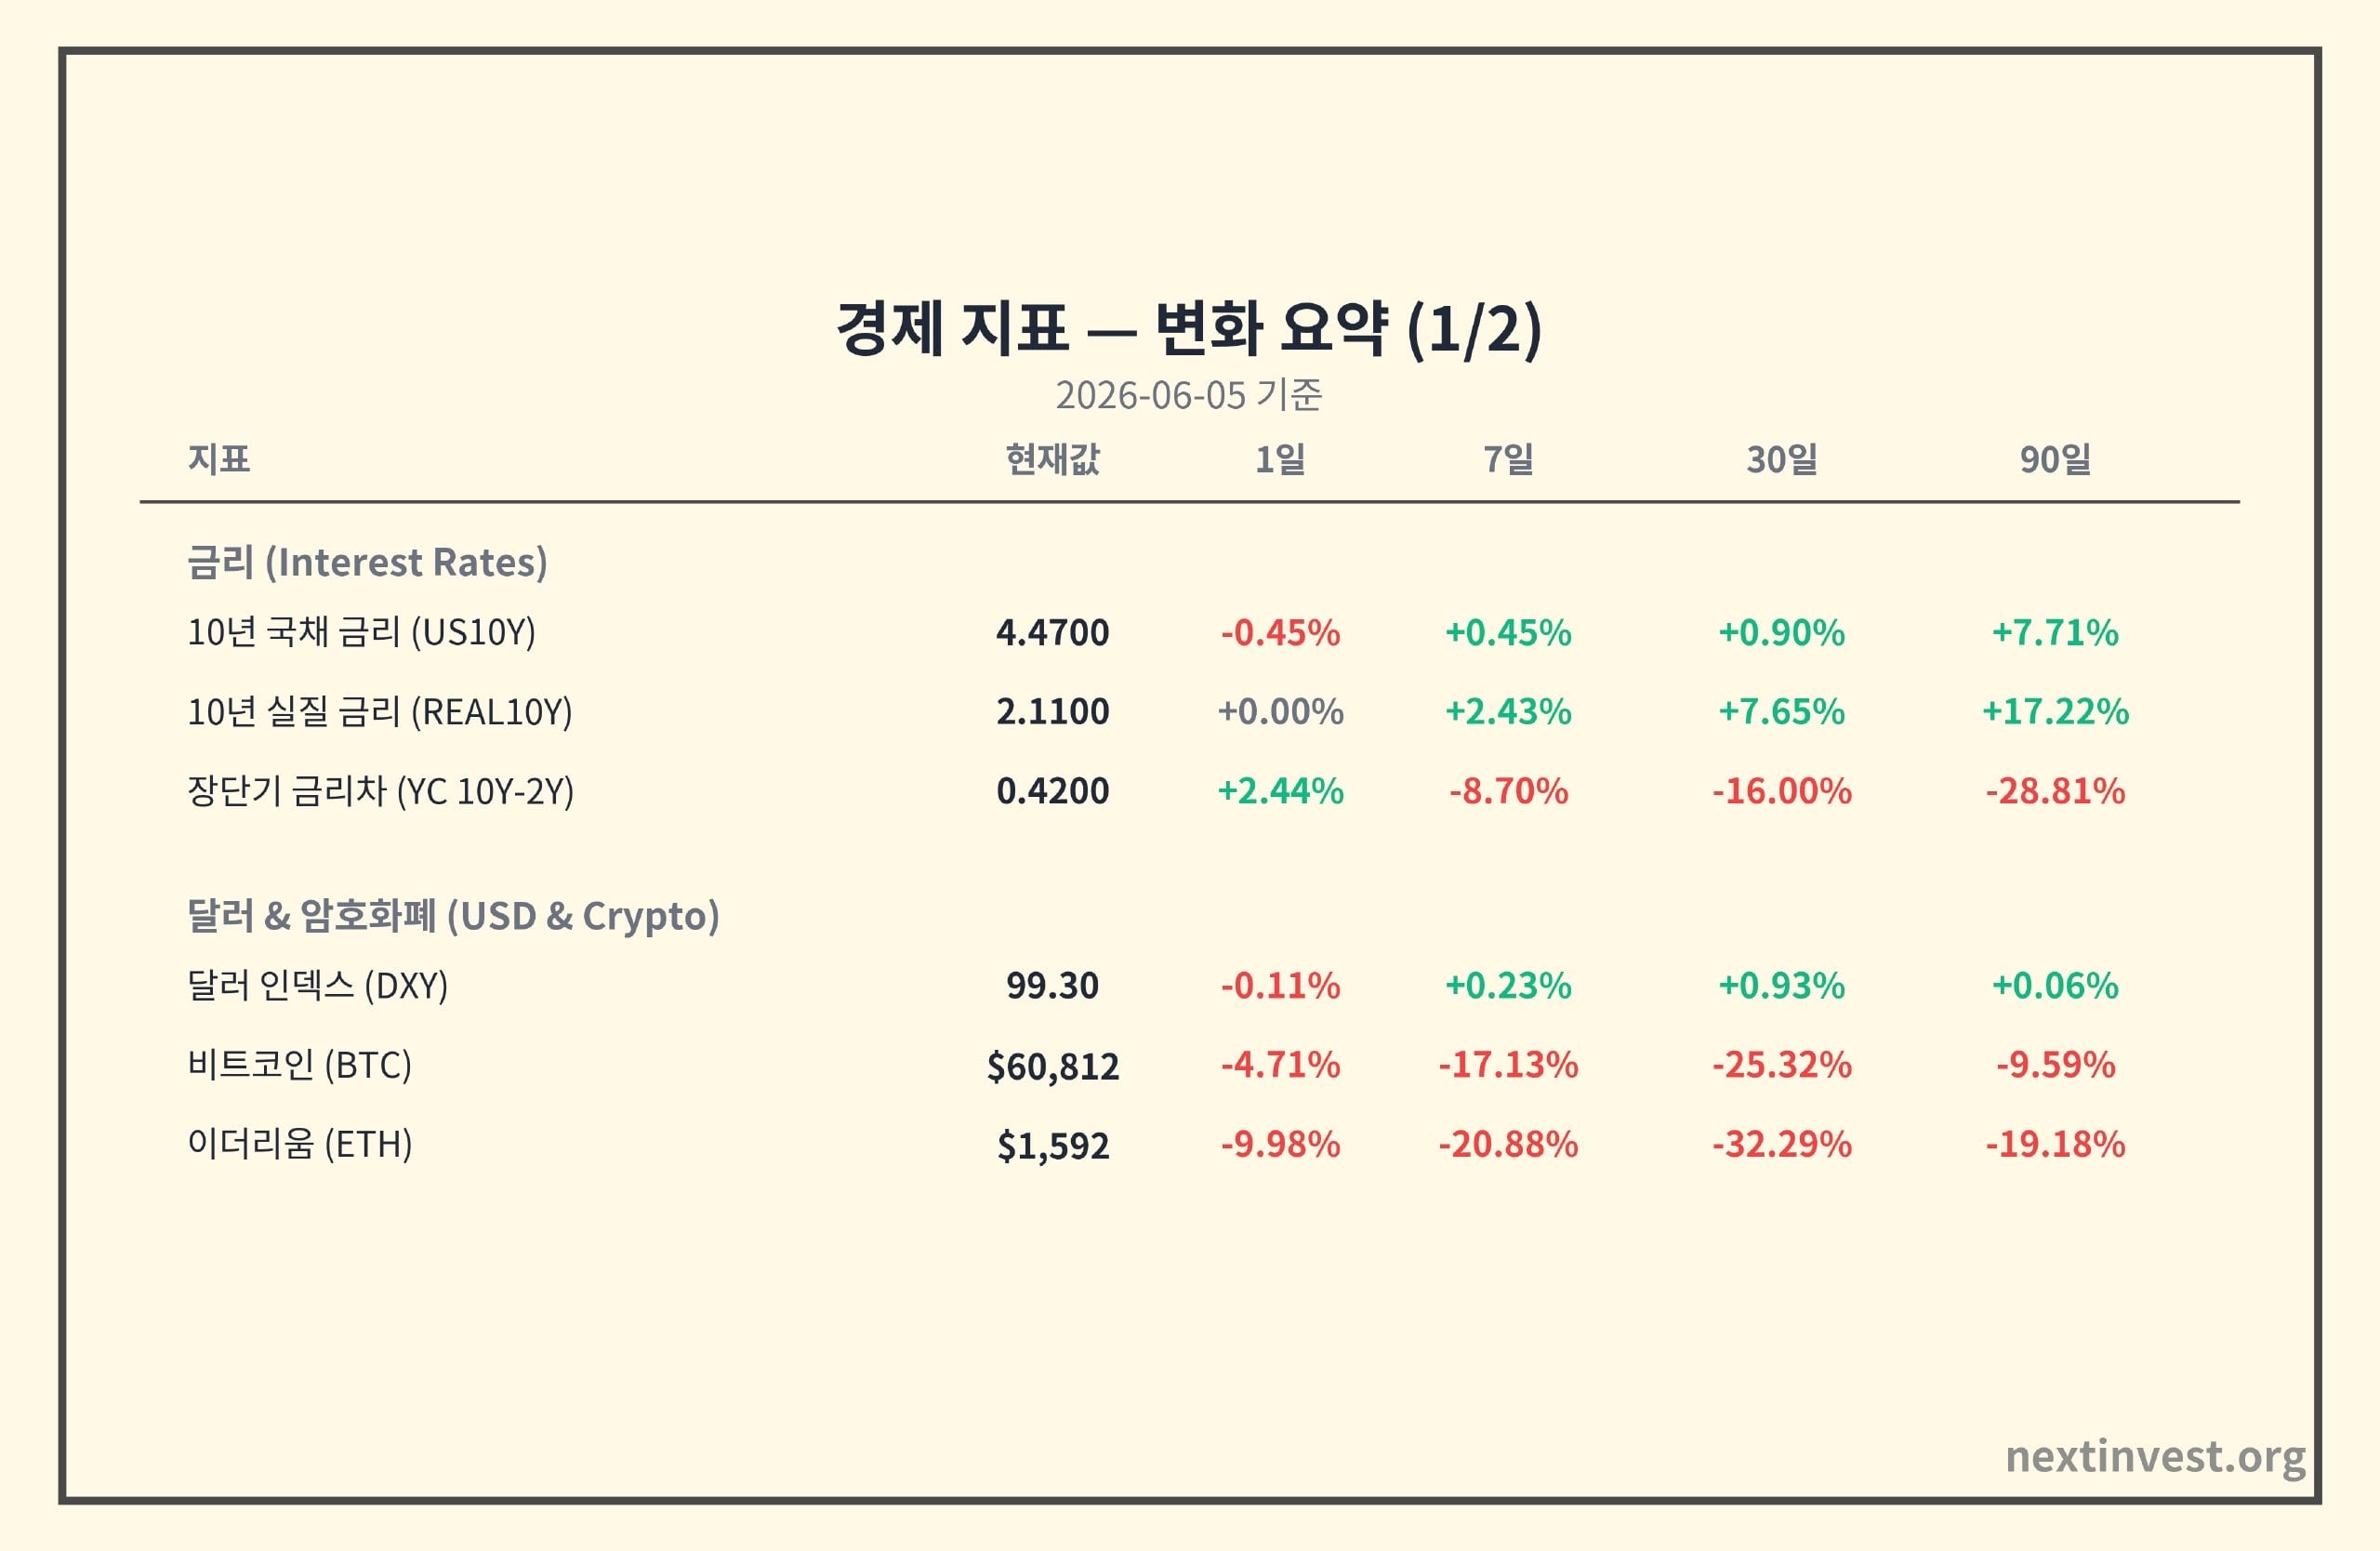
- Following this news, the U.S. 10-year Treasury yield rose slightly on a weekly basis (+0.45% / 7 days), and real rates (TIPS) jumped even more (+2.43% / 7 days), tilting once again toward a "world where borrowing money is more expensive."
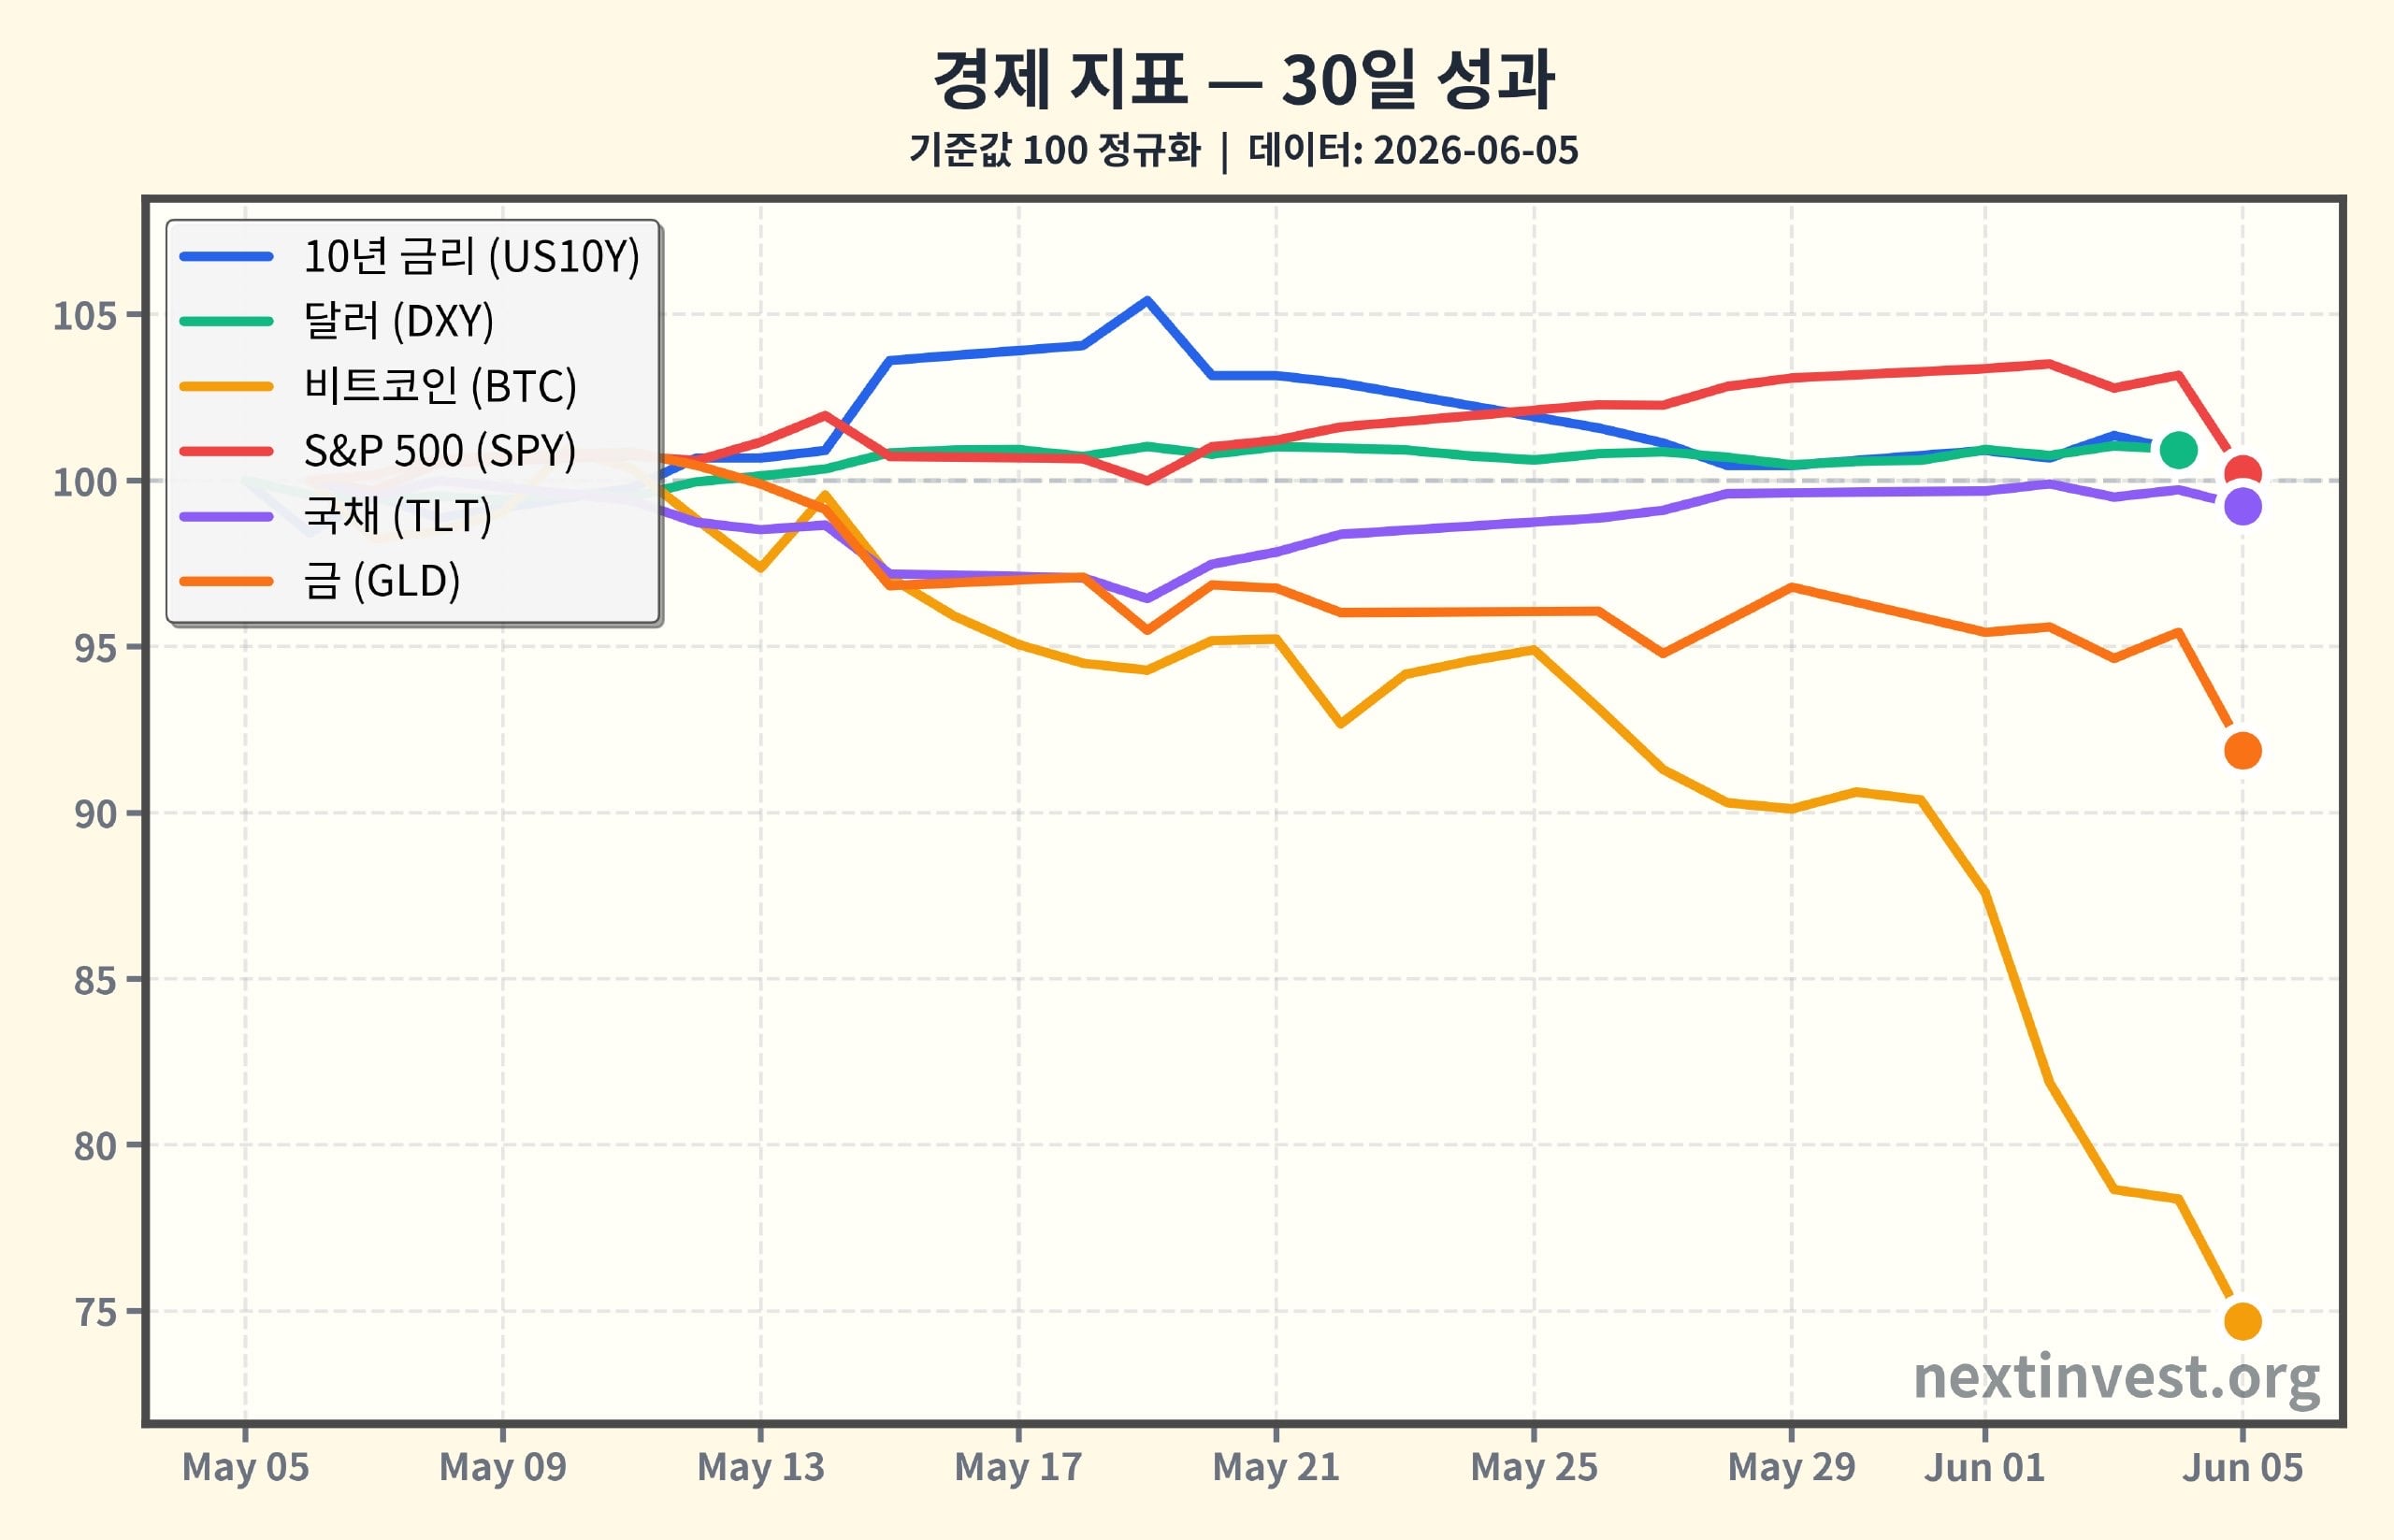
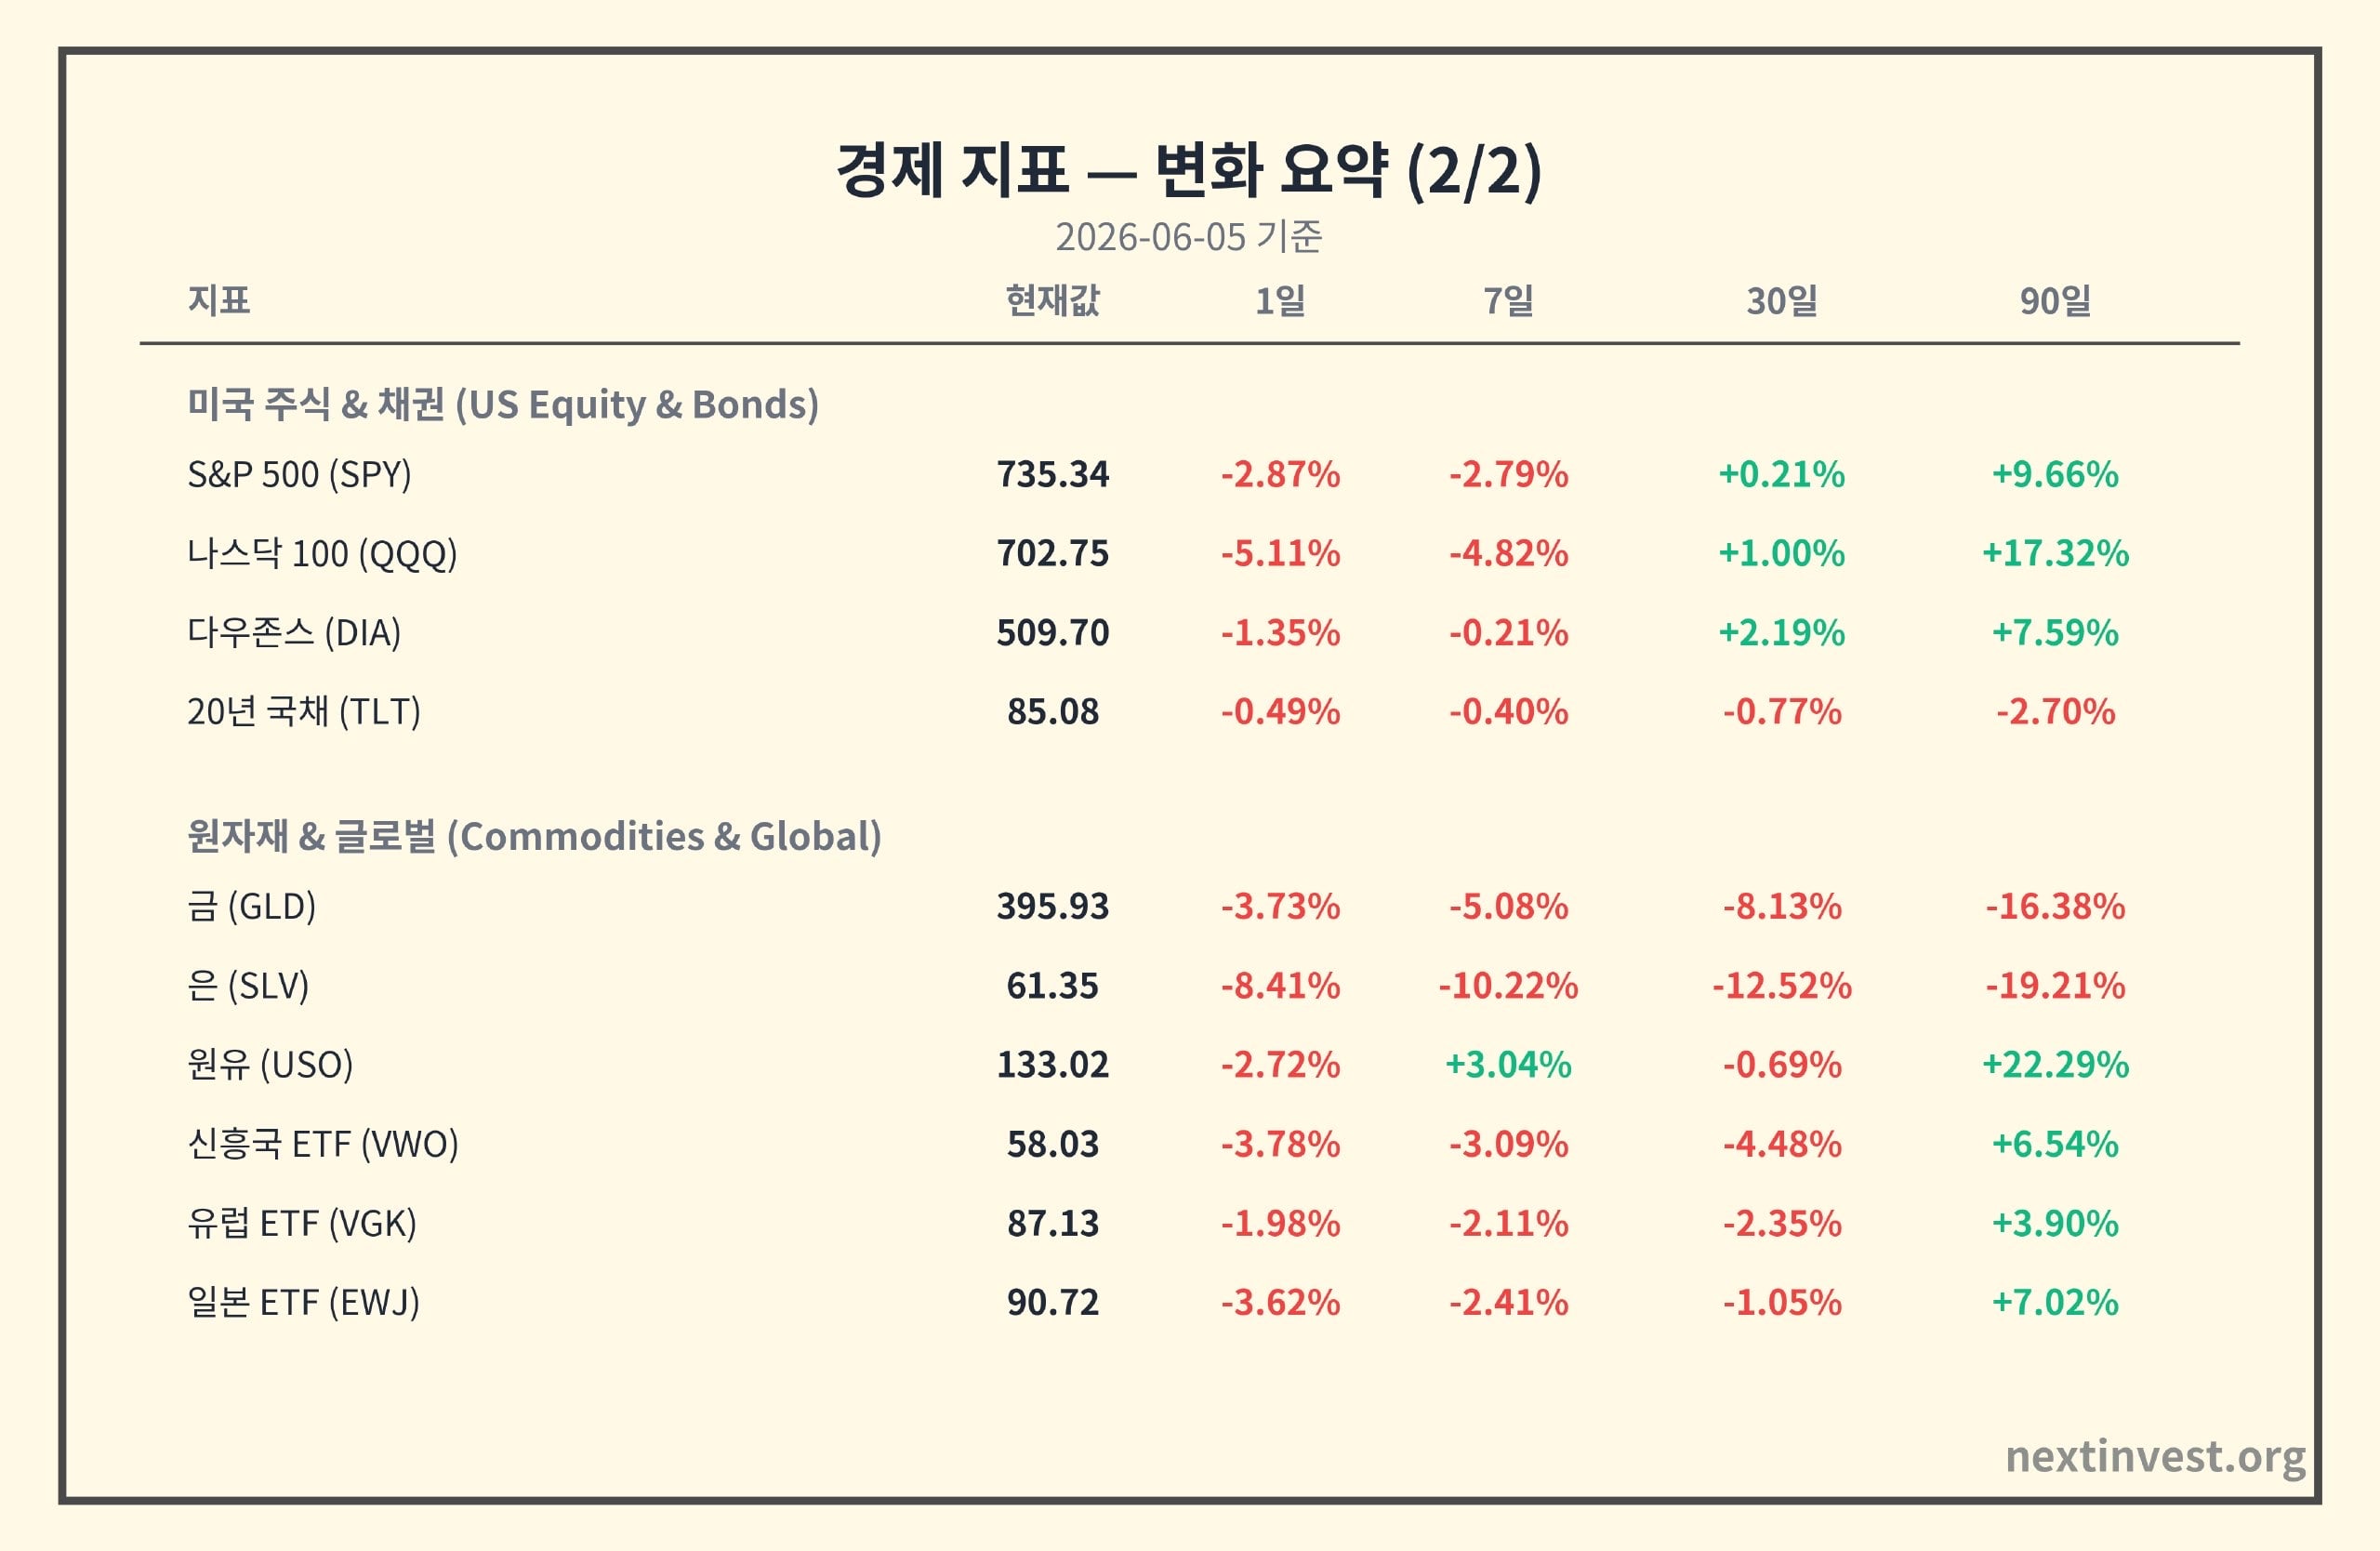
- As a result, large-cap tech stocks and cryptocurrencies related to AI plunged together, and the S&P 500 and Nasdaq posted their worst weekly performance in 10 weeks at -2.79% and -4.82% (7D), respectively. (apnews.com)
Now let me break this down by sector, step by step.
---
## Interest Rates and Bonds: "Interest Rate Cut Expectations Pushed Back Again"
### 1) Short-term vs. Long-term: The Market Speaks of "Prolonged High Interest Rates"
- 10-Year Treasury Yield: 4.47%
- Up +0.45% on a 7-day basis, +0.90% on a 30-day basis, +7.71% on a 90-day basis.
- 10-Year Real Interest Rate (TIPS): 2.11%
- Up +2.43% on a 7-day basis, +7.65% on a 30-day basis, +17.22% on a 90-day basis—rising more steeply.
In simple terms:
- Real interest rates are "the true interest rate after removing inflation." When this rises, it means "even after accounting for taxes and inflation, bonds look quite attractive."
- When long-term interest rates rise, the value of growth stocks (tech, AI) that depend on future growth expectations shakes first. This is because distant earnings appear smaller when discounted to present value.
### 2) Long-term Structure: The Fed Already Shifting to Easing, But Speed is the Issue
Looking at the long-term trend:
- The Federal Reserve's benchmark rate (FFR) has been continuously declining since November 2024 (5.33% → 3.63%, down approximately -21.8%).
- The 10-year yield also showed a gradual downward trend after its October 2023 peak (4.8%), but over the past 3 months it is regaining momentum.
In other words, the big picture shows "a shift from tightening to easing," but each time strong employment data comes out—as this week—"easing pace adjustment" kicks in.
### What Does This Mean for Investors?
- Bonds: With real interest rates structurally higher, U.S. long-term Treasury securities have entered a range where yields are "now quite attractive." However, as this week shows, when interest rates jump in response to employment and inflation data, bond prices (TLT -0.40% / 7D) experience significant short-term volatility.
- Stocks: For investors expecting "a growth stock rally from interest rate cuts," this is a signal that "it may take longer than expected." Even if you continue to hold quality long-term growth stocks, AI-related stocks with excessively high valuations (price relative to earnings) may face longer periods of adjustment and volatility.
---
## Dollar and Foreign Exchange: "The Dollar Quiet, Only Interest Rates and Stocks Wavering"
- Dollar Index (DXY): 99.30
- Up +0.23% on a 7-day basis, +0.93% on a 30-day basis, +0.06% on a 90-day basis—this week's movement was relatively minimal.
- However, looking long-term, the DXY has been on a gradual downtrend since its 2022 peak (-5.55%).
To summarize:
- This week's market stress did not stem from "dollar strength shock" but rather from "interest rate reassessment and stock and cryptocurrency valuation adjustment."
- The fact that the dollar did not spike significantly also suggests that the global financial system as a whole has not entered "crisis mode."
### What Does This Mean for Investors?
- For Korean investors who have invested in overseas assets (US stocks, dollar-denominated bonds), the impact of exchange rate fluctuations was limited, and the core issue was the price fluctuation of the assets themselves.
- If the dollar is in a long-term weakening trend, the expectation of "exchange gains" from dollar asset returns will be lower than in the past, and the "quality and profitability of underlying assets" will become more important.
---
## Stock Market: “AI Bubble Concerns Lead to Nasdaq Plunge, Dow Holds Steady”
### 1) Index Movements
- S&P 500 ETF (SPY): 735.34
- 1D -2.87%, 7D -2.79%, 90D +9.66%
- Nasdaq 100 (QQQ): 702.75
- 1D -5.11%, 7D -4.82%, 90D +17.32%
- Dow Jones (DIA): 509.70
- 1D -1.35%, 7D -0.21%, 90D +7.59%
On Friday, June 5th, the day of the May employment report,
- The S&P 500 fell -2.6%, and the Nasdaq fell -4.2%, marking its worst day since October last year. (apnews.com)
- The Nasdaq's decline was amplified by a significant drop in major semiconductor stocks related to AI, such as Nvidia and Broadcom. (kiplinger.com)
### 2) Why Were Tech Stocks Hit Harder?
There are three main reasons.
1. Interest Rate Sensitivity
- AI/tech stocks are assets that people buy today at high prices, believing they will make a lot of money in the future.
- When long-term and real interest rates rise, the present value of these future earnings is significantly reduced, resulting in a larger impact.
2. AI Expectations vs. Performance and Guidance
- When Broadcom released guidance that fell short of market expectations, concerns arose that "the AI cycle may be overheated" or "there might be an AI bubble." (kiplinger.com)
3. Overheated Positioning
- The Nasdaq and AI-related stocks have seen a very steep rise (+17% or more) over the past three months, with many investors heavily positioned using leverage and options.
- When interest rates and earnings data turn negative simultaneously, "profit-taking + forced liquidation" can compound the decline.
### What Does This Mean for Investors?
- Short-term: AI and tech-focused portfolios may continue to experience significant volatility like this week.
- Medium-term:
- While real economic indicators (employment, production) are relatively solid, a delay in interest rate cuts could lead to a situation where "growth occurs but valuations are compressed."
- In this environment, value stocks and defensive sectors (healthcare, essential consumer goods) with stable dividends and cash flow may outperform or hold up better.
---
## Commodities and Cryptocurrencies: “Oil Strong, Gold, Silver, and Coins Plunge”
### 1) Commodities: Divergent Week for Inflation Hedge Assets
- Oil ETF (USO): 133.02
- Up 3.04% over 7 days and 22.29% over 90 days, continuing its strong upward trend.
- Geopolitical tensions and supply disruption concerns persist, and oil prices rose more than 3% this week. (kiplinger.com)
- On the other hand, gold (GLD) fell 5.08% over 7 days and 16.38% over 90 days, while silver (SLV) dropped 10.22% over 7 days and 19.21% over 90 days.
Why?
- Oil prices are "more sensitive to the real economy + geopolitics." If supply disruptions occur or wars and conflicts prolong, prices may rise further until the economy slows down.
- Gold and silver are "more sensitive to real interest rates and the dollar." When real interest rates rise, the opportunity cost of gold and silver, which do not pay interest, increases, putting pressure on prices.
### 2) Cryptocurrency: Worst Week for Crypto Since July 2024
- Bitcoin (BTC): $60,812
- 7D -17.13%, 30D -25.32%
- Ethereum (ETH): $1,592
- 7D -20.88%, 30D -32.29%
This week's sharp drop in Bitcoin and Ethereum can be attributed to three key factors.
1. Large-Scale Leverage Liquidations (Forced Short Selling)
- Between June 3rd and 4th, as Bitcoin fell below $62,000, approximately $1.5 to $1.8 billion worth of leveraged positions were forcibly liquidated (cryptotimes.io).
- Most of these were long (bullish) positions, with Bitcoin and Ethereum at the center of the liquidations.
2. ETF Outflows ('Cash is Leaving' Market)
- Over a period of 10 days, US Bitcoin and Ethereum spot ETFs experienced net outflows of approximately $2 billion. In early June, ETF redemptions continued, leading to a vicious cycle of "price drop → ETF redemption → further drop" (cryptothreads.io).
3. Capital Reallocation from AI and Tech
- Some analysts suggest that hundreds of billions of dollars have flowed into AI infrastructure investments (data centers, semiconductors) in recent months, leading to "capital rotation" where funds are being withdrawn from risk assets like Bitcoin (crowdfundinsider.com).
Result:
- The total market capitalization of the coin market has significantly decreased, with Bitcoin hitting a four-month low and Ethereum nearing a 14-month low (ccn.com).
- The Fear & Greed Index has fallen into the "Extreme Fear" zone, indicating a significant contraction in investor sentiment (reddit.com).
### What Does This Mean for Investors?
- Long-Term Investors:
- This week's drop was largely amplified by "leverage and ETF fund flows" rather than fundamental factors (blockchain technology, adoption trends).
- However, it is important to acknowledge that in the short term, cryptocurrencies have become much more sensitive to regulatory and macroeconomic variables (interest rates, dollar, risk asset preferences).
- Short-Term and Leverage Traders:
- During periods of sharp drops like those seen in early June, reducing leverage, setting stop-losses, and adhering to risk management principles are paramount.
- Bitcoin's level around $60,000 is often cited as a short-term 'psychological and technical support line,' but it can easily be broken depending on macroeconomic factors (especially US employment, inflation, and Fed commentary) (coindesk.com).
---
## Key Points to Watch Next Week: "Every Data Point Reshapes Interest Rates and Valuations"
1. US Inflation Indicators (CPI, PCE Release Dates)
- CPI and core PCE have already shown a long-term gradual increase (+1.5% range).
- The most crucial question is "How quickly are wages and service prices cooling down?"
- If inflation declines slower than expected, the pattern of "reduced expectations for interest rate cuts → increased volatility in growth stocks and coins" seen this week could repeat.
2. Fed Member Comments and Expectations for June FOMC Meeting
- 4~5 May released FOMC minutes show that some members still "worry about the risk of inflation becoming entrenched again." (federalreserve.gov)
- Given strong employment, if Fed members' tone shifts to "very cautious doves (easing cautiously)" next week, the timing of interest rate cuts could be pushed back to late 2026.
3. AI·Semiconductor Earnings and Guidance Updates
- This week, Broadcom's guidance reignited the AI bubble debate. (kiplinger.com)
- If major AI infrastructure companies continue to comment next week, "whether earnings are truly meeting expectations or if expectations have gotten ahead of themselves" will be immediately reflected in stock prices.
4. Cryptocurrency: ETF Fund Flows and On-Chain Data
- The scale of inflows and outflows from Bitcoin·Ethereum ETFs, and the movements of long-term holders on the blockchain, will be key indicators for gauging short-term lows.
---
## Summary: This week in a nutshell
> "The economy is stronger than expected, but the market is struggling because of it."
- Strong employment → Delayed interest rate cut expectations → Long-term interest rates and real interest rates rise → Adjustment in high-risk, high-valuation assets such as AI·tech·coins.
- However, the Fed has already signaled a shift towards ending tightening and moving towards gradual easing. Real economic indicators also point to "resilient slowdown" rather than recession.
For investors,
- Check if the proportion of growth stocks and momentum assets in your portfolio is excessively high.
- Assess whether you have a sufficient amount of cash flow, dividend, and quality assets that can withstand rising real interest rates.
This content is for informational purposes only and does not constitute investment advice for any specific security or asset.
Source: https://nextinvest.org/ko
Free to share ^^