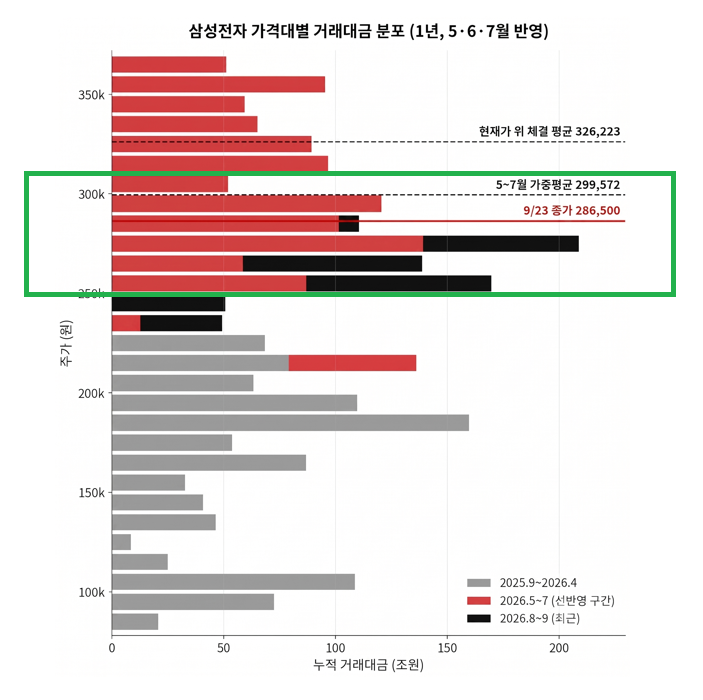
Today, I would like to report on the analysis and valuation category analysis based on raw data for the past year, focusing on demand curves.
Chapter I. Analysis of Samsung's Price/Demand Volume (Transaction Value) Curve and Range Price
As you can see below, the basic structure is similar to a general demand curve. Green represents "market failure" in May, June, and July, which we define as overheating due to "excessively rapid reflection." Red represents "market failure" in May, June, and July, which we define as inherent overheating. The two scenarios have different solutions.
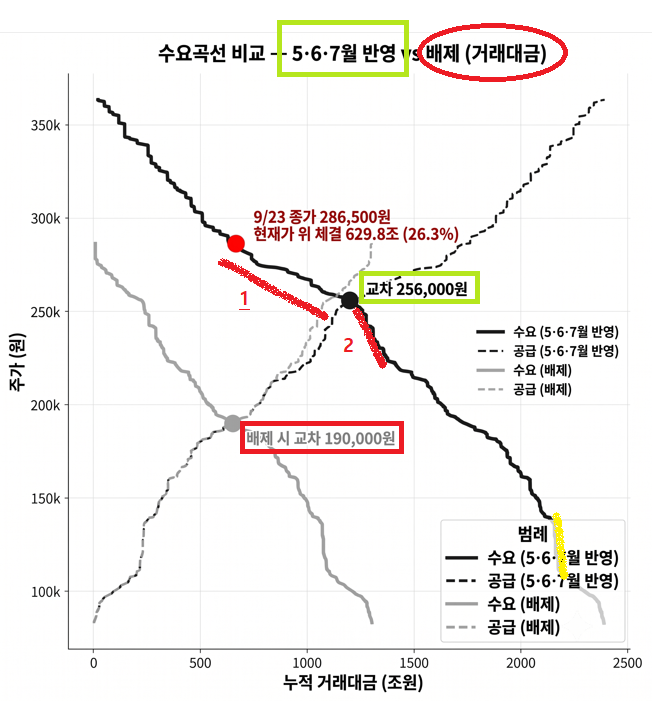
Market Failure in May, June, and July (Overheating Beyond Short-Term Overheating Due to Hedging): Exclude May, June, and July
In this case, the gray line on the left is the normal demand curve. Overall elasticity is consistent, with the intersection point, 190,000 won, being a central point where there is always a risk of decline. Moreover, the current section is at a point where the slope of the demand curve itself has reached its "limit." This means that a separate "momentum" is needed for the demand curve to move to the right.
Assuming Overheating in May, June, and July as "Excessively Early Reflection Overheating": Include May, June, and July
In this case, the black demand curve in the middle is used. We will interpret it based on "elasticity."
-. Red 1 represents the current stock price box: The transaction value changes significantly even with a slight change in price. This can be considered a stock liquidation zone and a zone where self-trading profits (foreigners, etc.) are generated due to share buybacks.
-. Red 2 has low elasticity (price demand elasticity): The transaction value remains at a constant level regardless of price fluctuations. In other words, this section is a place where "supply and demand are alive." Conversely, it can be interpreted that there is always "latent demand" here. We see the current point as the bottom.
Conclusion
1) If the overheating in May, June, and July was considered a market failure, then new momentum is needed. This means that Micron's earnings on 9/29 and Samsung's earnings announcement in early October are "very important."
2) If the overheating in May, June, and July was due to "excessively early reflection" and its resolution, then the time has come for Samsung's "appropriate valuation" under normal trends. Considering the price elasticity of each section at this time, the current box range (250,000-290,000 won) is a zone for stock liquidation and short-term trading.
3) In both cases, "Micron's earnings and the earnings announcement in early October" will undoubtedly be very important variables.
Chapter II. Changes in Samsung's Valuation PBR Multiple
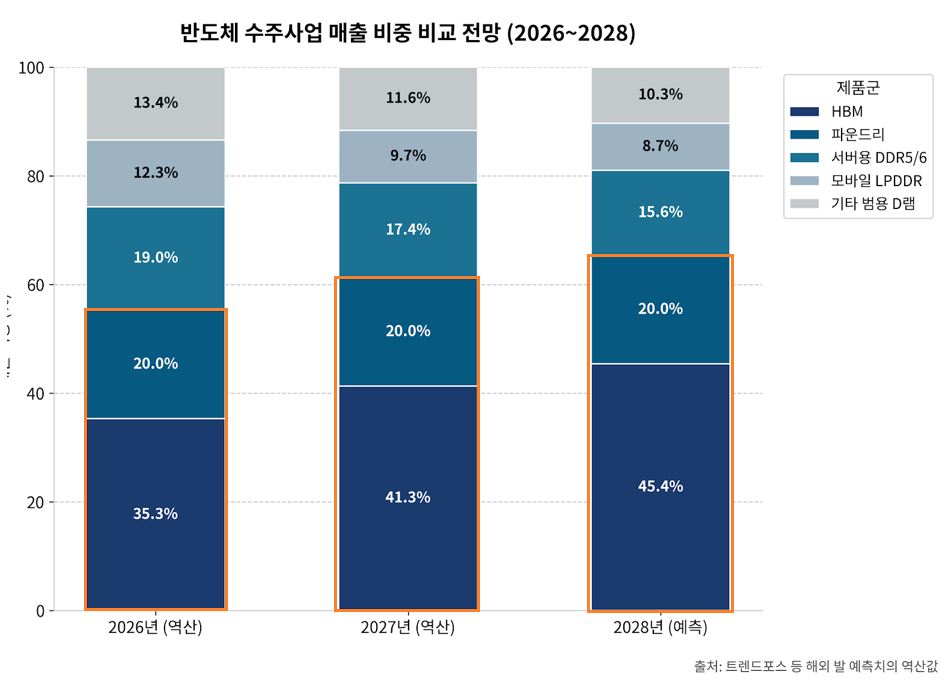
Proportion of Semiconductor Products (Including Orders) in Samsung's Sales
-. Estimates "reverse-calculated" based on external sources such as transport articles.
-. As you can see below, the proportion of sales with "structural profitability" that can be classified as "order-based industries" is continuously increasing. This will be a decisive key for the subsequent comparison of valuation with TSMC.
Comparison of TSMC Valuation with PBR Valuation
-. Domestic experts generally agree that Samsung's profits are divided 5:5 between cyclical DRAM and products reflecting structural growth potential. This is a reasonable assessment at the current point in time, according to Hyun Kun Chang, Research Center Director of Hyundai Motor Securities.
-. The reliability of this assessment depends on individual acceptance.
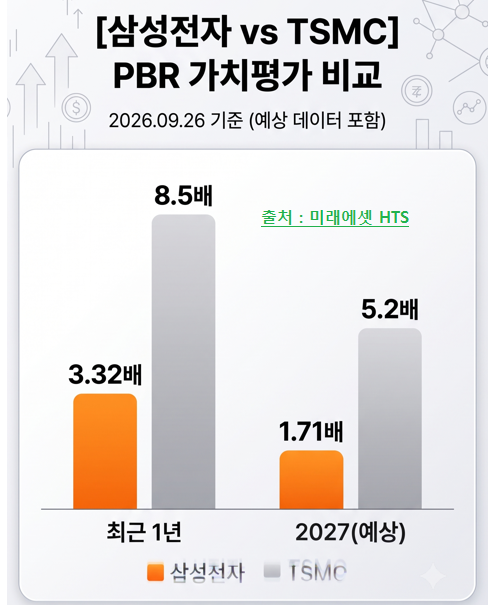
3. PBR Valuation
Currently, TSMC is experiencing a temporary high valuation of 8.5 times PBR and its stock price is rising. However, after reflecting facility expansion next year, it will converge back to the normal valuation of around 5 times PBR. On the other hand, even if Samsung Electronics reaches 2027, its PBR valuation will be lower than usual. This shows the potential for "structural profitability" to expand.
Assuming that the proportion of structural profitability in the above item 2 is further enhanced by the positive aspect of "foundry deficit resolution," it will reach about 50%. In this case, the proportion of "structural growth" in sales and profits will increase somewhat. It is impossible to determine how much the multiple will be reduced. However, let's assume the following categories.
(Hanwha Investment & Securities and recent Yuantta Securities 2027 BPS 180,000 won)
A. Expanding the multiple for all of Samsung's sales: In this case, the minimum PBR value is 3 times, which corresponds to a level of 540,000 won.
B. Applying a minimum PBR of 3 times only to 50% of Samsung's sales, reflecting structural profitability
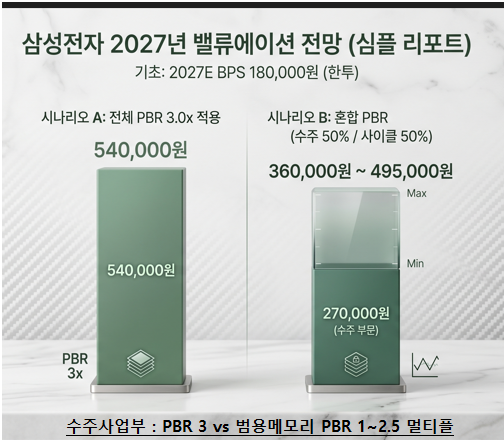
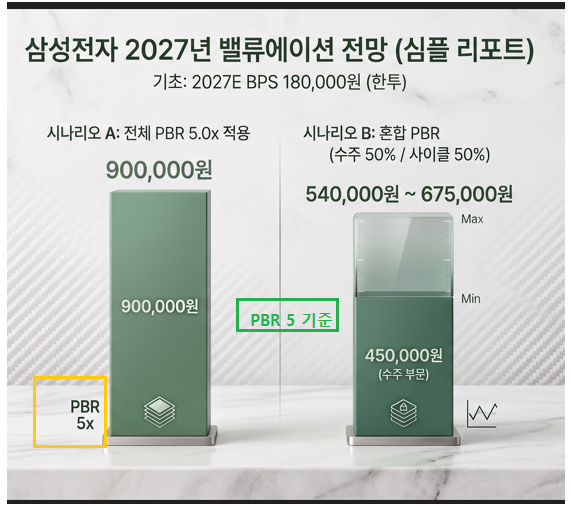
Classify Samsung's order products and general DRAM by TSMC standards under the same conditions.
Now, applying a PBR of 5 times, we will apply the entire proportion to PBR x5 and keep the order industry at x5 while the general DRAM maintains the existing PBR x1 ~ x2.5.
Chapter III. Conclusion Valuation and Short-Term Fluctuations : Conclusion
1. Based on various technical analyses, Samsung is expected to hit a low point in October and enter an (gradual) uptrend.
2. While there are various possibilities, assuming there is no new momentum, it could temporarily fall below 250,000 won near the previous low. However, we believe this possibility is small if there is an adequate level of momentum. In this case, the lowest point is seen at around 260,000 won.
3. Currently, technical analysis shows a possibility of temporarily breaking through the upper resistance line in (short-term trend) Bollinger Bands and various aspects. Based on "personal trend judgment," the maximum is 310,000 won, while other technical aspects show values around 290,000 to 300,000 won. This is seen as a possible figure before and after the dividend cut-off date.
4. When hitting a low point in October, macro variables are expected to have significant room for improvement. We will explore this further in a separate fundamental analysis. Currently, interest rates/oil prices are approaching their peak levels, and further increases from the current international situation and environment seem unlikely. There is a high possibility of remaining at a short-term fluctuating level. Refer to analyses by leading hedge fund managers and economists for more information.
5. Samsung's valuation recognizes its structural nature, and applying a minimum PBR of 3 times only to the "order business unit" makes it possible to achieve:
-. At least 360,000 won in 2026
-. At least 540,000 won in 2027
If Wall Street's actual investors expand the PBR multiple (as in TSMC's past 5 times), even higher figures are possible. However, this is not a decision we make.
6. TMI: The put-call ratio of Micron Technology has dropped to a 1:1 level, and there is an increase in short-term long positions. It is preemptively predictable that Micron's earnings surprise (at least slightly exceeding consensus) is possible. However, only Micron insiders would know this.
My days of analyzing Samsung are coming to an end. Personally, I believe October will be the last month for volatility adjustments. After that, analysis becomes unnecessary. Once the direction is set, we can simply make normal investments.
Thank you for reading this long post.
ft. 1-year data as of the current point, Samsung's wall of supply
- As it coincides with the demand curve, the current stock price has the most supply.