Hello. This is part 3 of the stock price simulation analysis.
This time, I added a comparison feature.
Previously, it was only possible to compare with S&P 500 stocks, but now I've changed it to allow comparison with all provided stocks. Also, I've modified the UI so that the simulation return distribution can be compared at a glance.
Let me show you an example by comparing Samsung Electronics and SPY. When you click the comparison button on the right, a text box appears where you can search for the stock you want to compare.
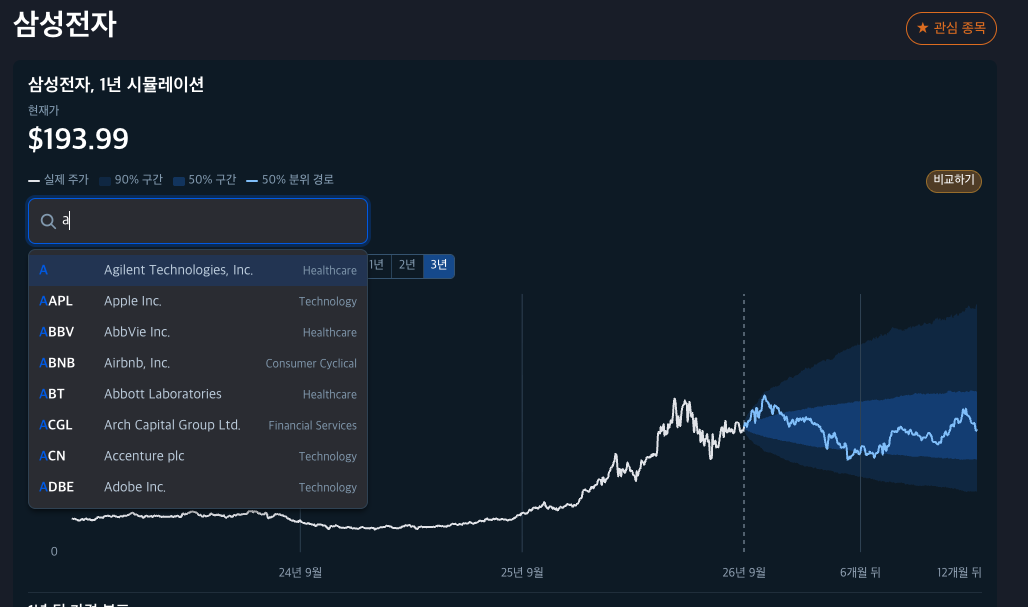
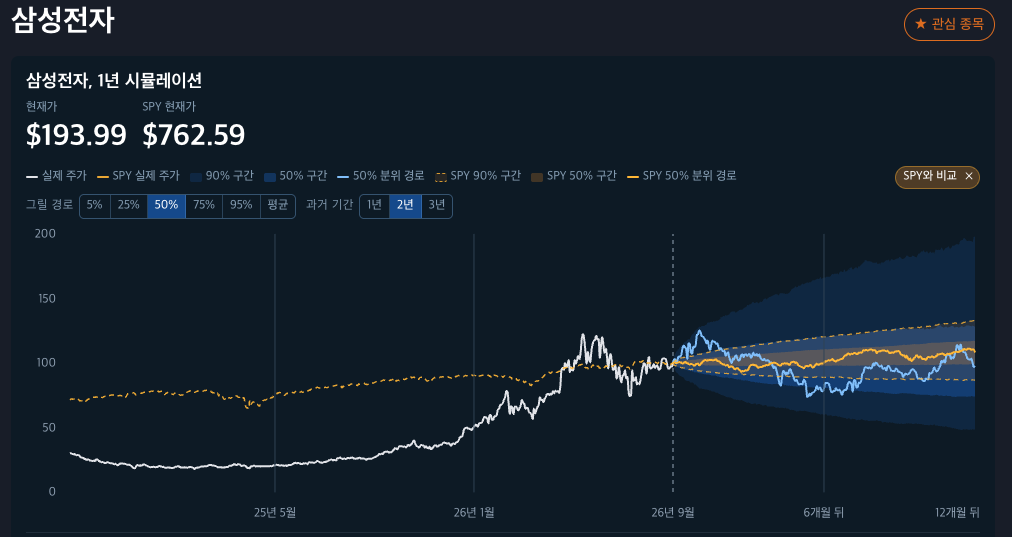
I selected SPY, and the yellow line represents SPY.
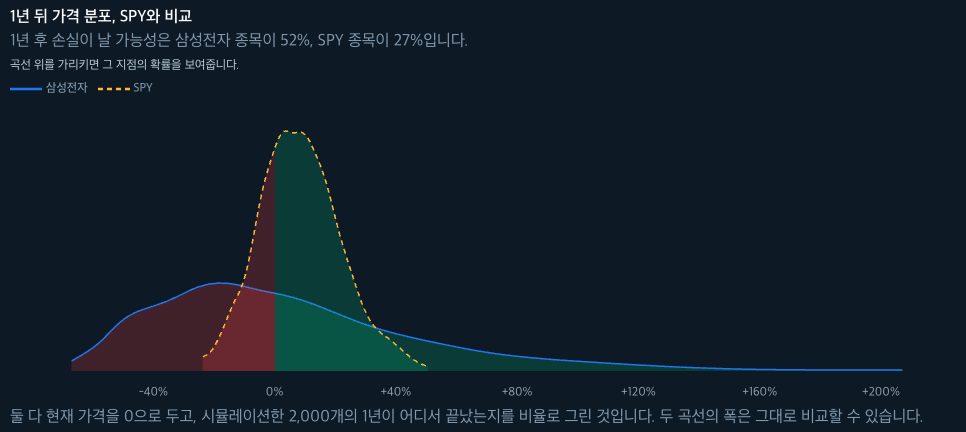
I paid some attention to this part. I plot the returns of the two stocks being compared in one distribution chart. The current baseline is at 0%. So the red area represents cases where there's a loss from the current price, and the green area represents profit/loss compared to the current price. The probability of loss in 1 year is 52% for Samsung Electronics and 27% for SPY.
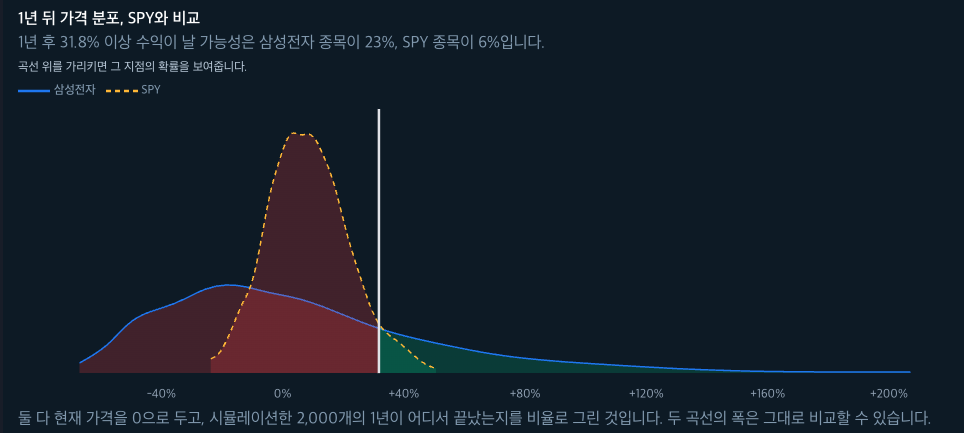
When you move your mouse over the distribution chart, it shows the possibility of loss/profit for each return rate. On the current screen, the mouse cursor is positioned at the 31.8% return rate.
The probability of achieving 31.8% or more profit in 1 year is 23% for Samsung Electronics and 6% for SPY.
In short, compared to SPY, Samsung has a higher possibility of loss, but also a higher possibility of hitting big gains of 30% or more.
And I've also made it possible to compare in portfolio analysis. In this example, I created a portfolio by mixing SPY (70%) and SCHD (30%). Again, if you click the comparison button on the right, you can search for the stock you want to compare, or you can choose from your own saved portfolios. I'll select my saved SPY (90%) SK Hynix (10%) portfolio.
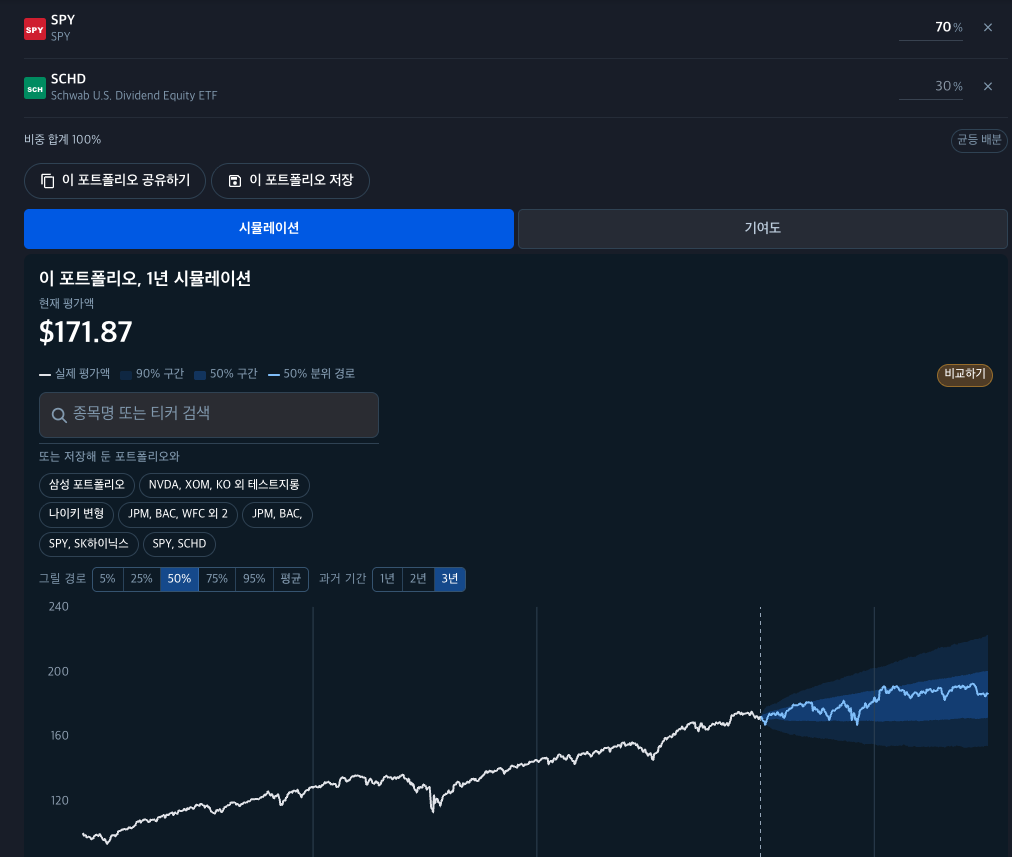
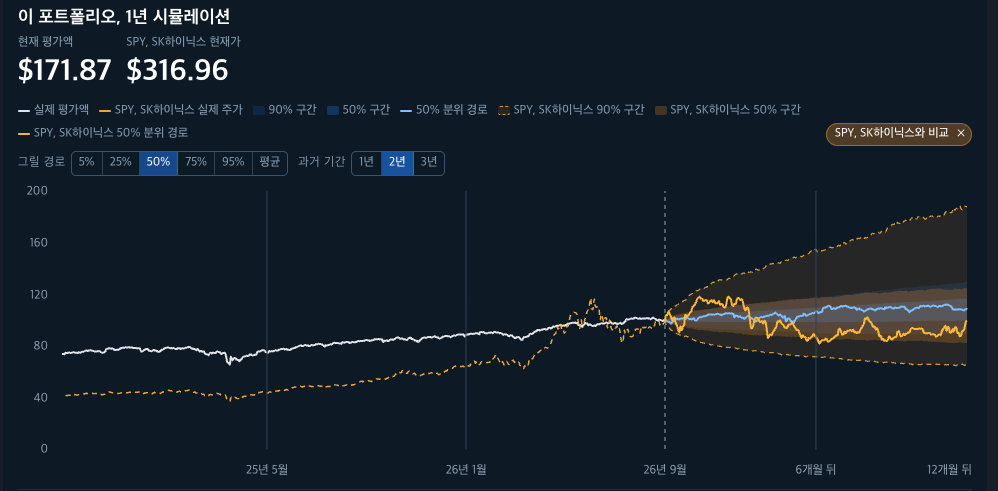
Then a line chart comparing the two portfolios is drawn.
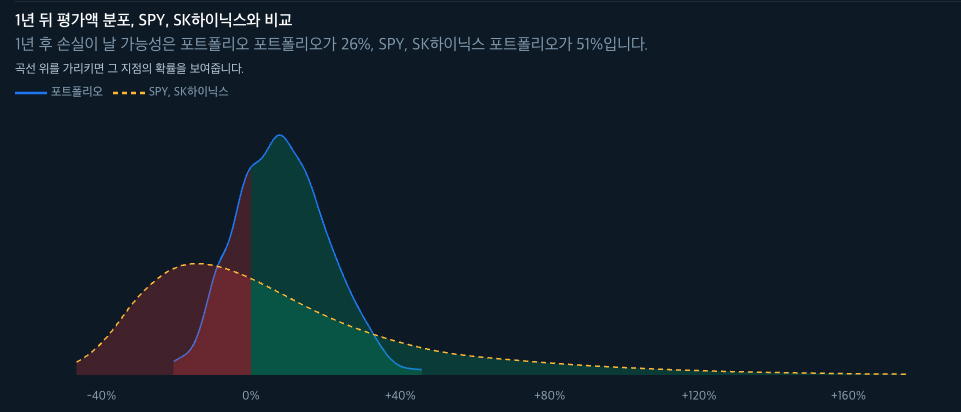
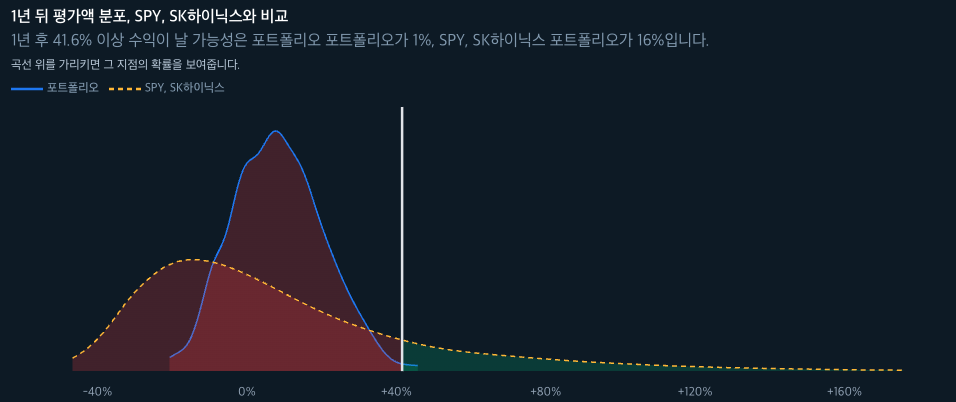
The distribution chart is also displayed. Of course, a portfolio mixing SPY with the safer SCHD would be safer than the SPY-Hynix combination, right? The probability of loss for the SPY-Hynix combination is almost double.
For the SPY-SCHD combination, the possibility of a loss of 20% or more is virtually zero.
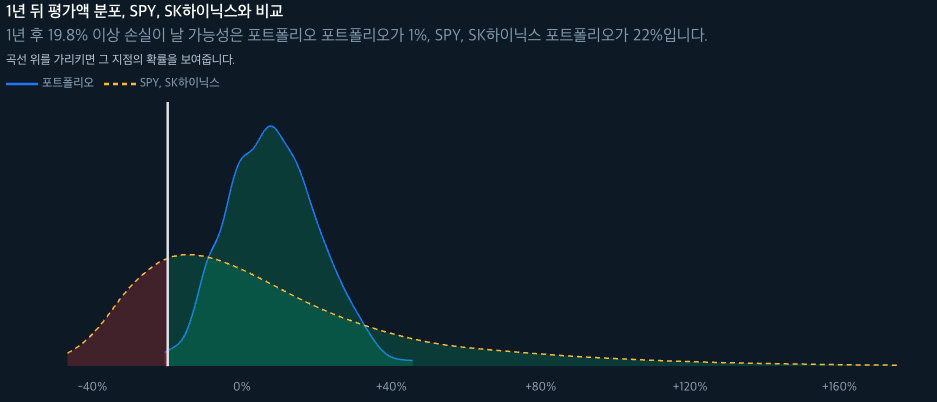
On the other hand, the SPY-SCHD combination has virtually no possibility of achieving a 40% or more big gain. For the SPY-Hynix combination, the probability of achieving 40% profit comes out to 16%.
Well.. Of course, it's related to investment performance, but as I looked at and analyzed several portfolios, I felt like this... "There's nothing better than just an S&P 500 index fund.... ㅋㅋㅋㅋ"
No matter how much I racked my brains and tried to combine things, it didn't amount to much. The results were really honest.
High return = High risk
I haven't been able to find a combination that minimizes risk while maximizing returns... yet.
This time, I added a simulation comparison function and a portfolio saving function. I wonder how you'll feel about it.
Please feel free to use it if you are interested! Have a great weekend!!
Source: https://nextinvest.org/ko