It is showing a very classic and powerful technical analysis pattern.
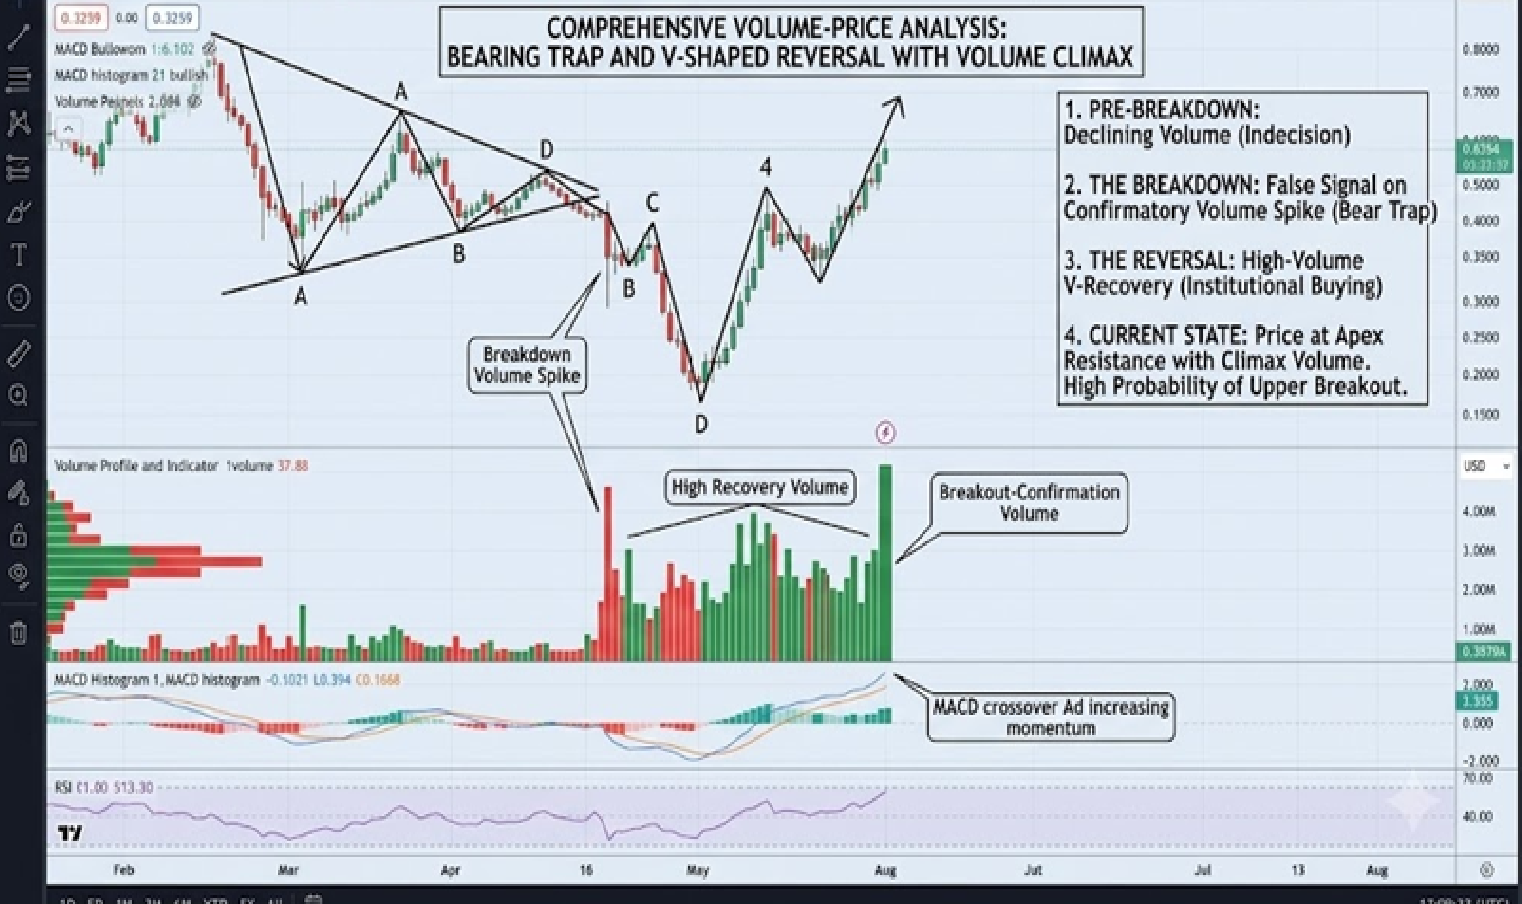
This is a picture I picked up while studying technical analysis before; in cases like this it runs strongly up to wave 5,
and it would have to hold at the top for more than two months, which does not look easy ....
In any case, accompanied by heavy volume, it will need re-verification at the correction stage after a dead cross of the MACD1226 signal line. A very textbook pattern appeared, so I am sharing it.
What is a bit different is that Nasdaq 100 futures, without even the pullback seen at number 4 in the picture above, played around at highs and then last night produced a rise beyond expectations. Ah, writing in polite form is hard ㅎㅎㅎ

