While mulling over this and that,
I often noticed candles that revert after a strong drop or a strong rise, so after confirming it with my own eyes
I once ran a regression test.
This content is for day trading, so from a long-term trading perspective please treat it as just an entry point.
Simply put, based on the opening price, up to 0.4, 0.5, 0.6, 0.7 and 0.8 of the 20-day average daily range,
I once ran a regression backtest.
The stop loss is the size of the daily range, that is, the 1.0 zone
Among the 0.4, 0.5, 0.6, 0.7 and 0.8 ranges, the best returns came from the 0.4 and 0.6 zones (0.5 is fine too ㅎㅎ); in the script I take 0.4 and 0.6 as the buy or sell reference, and 0.6 is powerful
After a strong drop or rise, the 25%~50% zone showed a reversion rate of well over 90%
With this view, at first I drew reference lines in Pine Script matched to the drop or rise over a one-day zone and inspected them by eye.
Zones where it dies did show up.
So I refined it further. That is, dividing by the ICT-KILLZONE, namely the hours when the Asian session, the Euro session and the New York (US market) session open, and redrawing the entry lines based on the opening price of each session.
It is as follows
1.0 (stop loss), 0.6 (strong buy or sell zone), 0.4 (zone to consider a first buy when volatility is low)
It is divided like this
and relative to the current price, the lines above are sell (Short) lines and the lines below are buy (Buy) lines
The last line at the top and at the bottom is the stop loss (SL) line
Combined with the 200 moving average it should become even more powerful
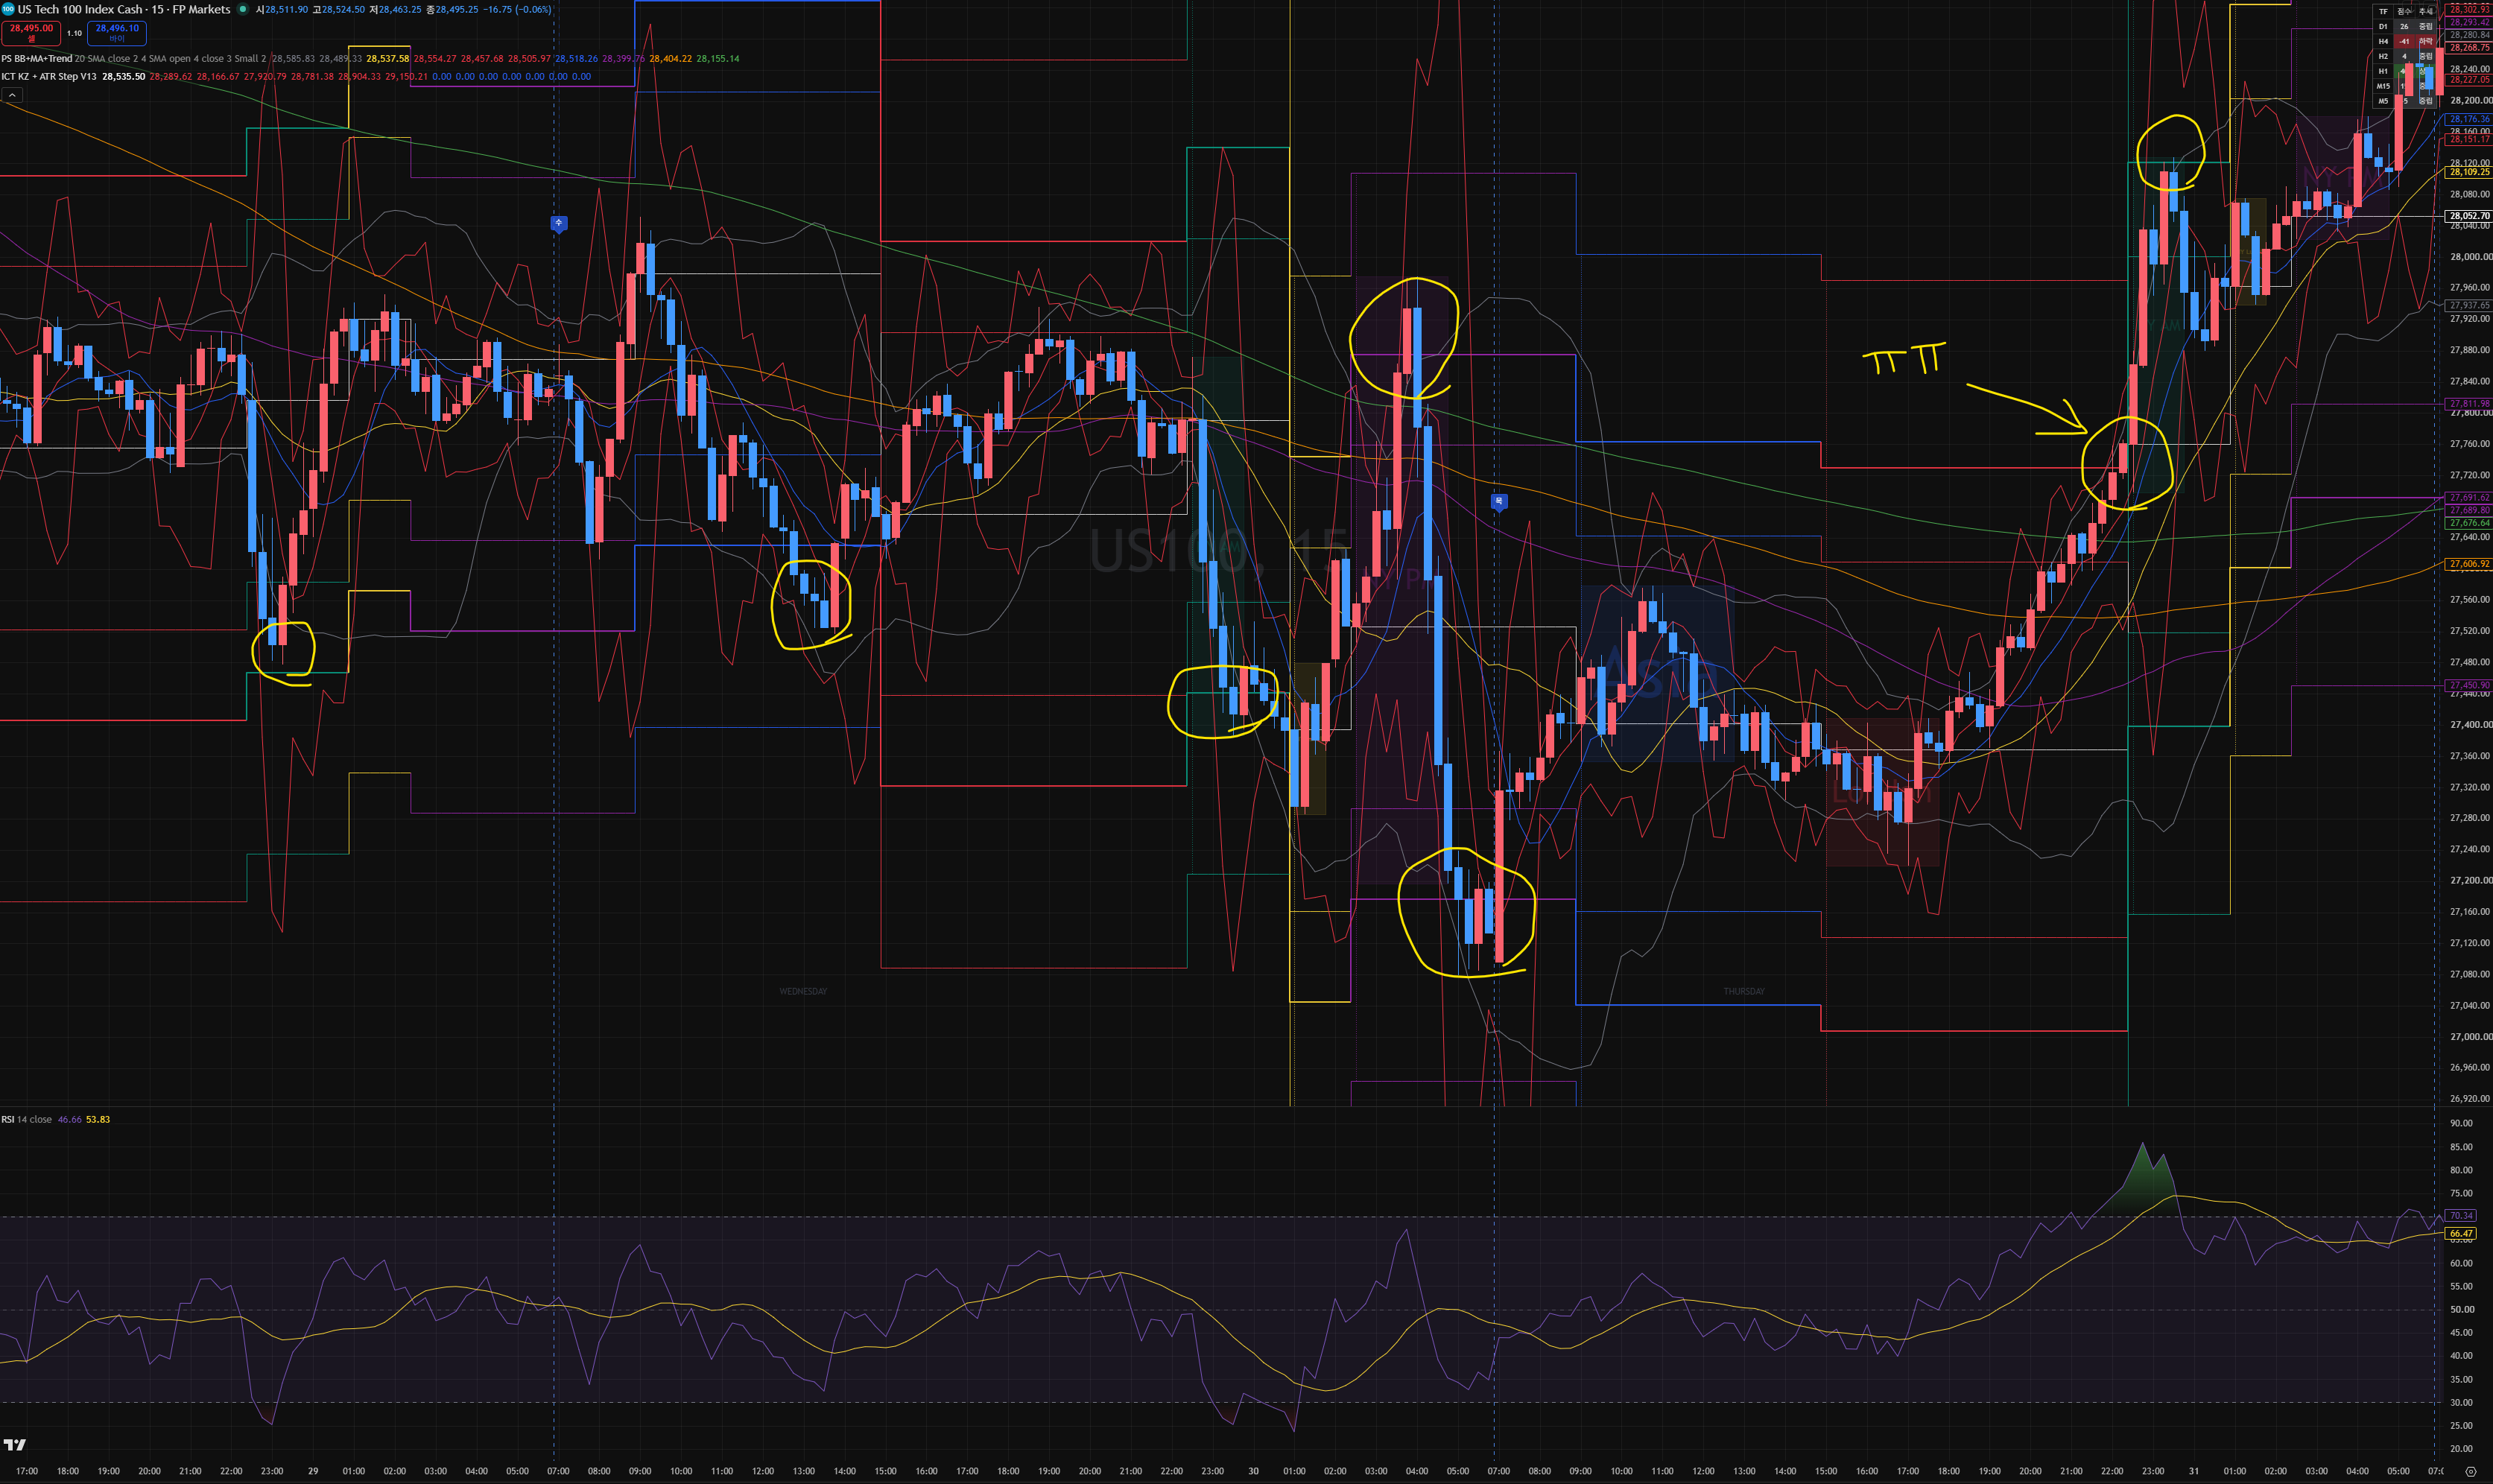
The graph in the image
is the Nasdaq chart with the Pine Script applied, which I then checked by eye.
The parts circled in yellow are the entry points, the zones where a 0.6 range move occurred.
It survived almost without dying, and died once in a sharp rise zone. Even if you get stopped out, if you buy in the 0.6 zone the level is 0.4, so relative to the win rate the swing is not large.
And on a rising curve like that, personally I would have skipped that session.
It would be good to take the entry point when at minimum the 1-minute candle approaches the 200 moving average.
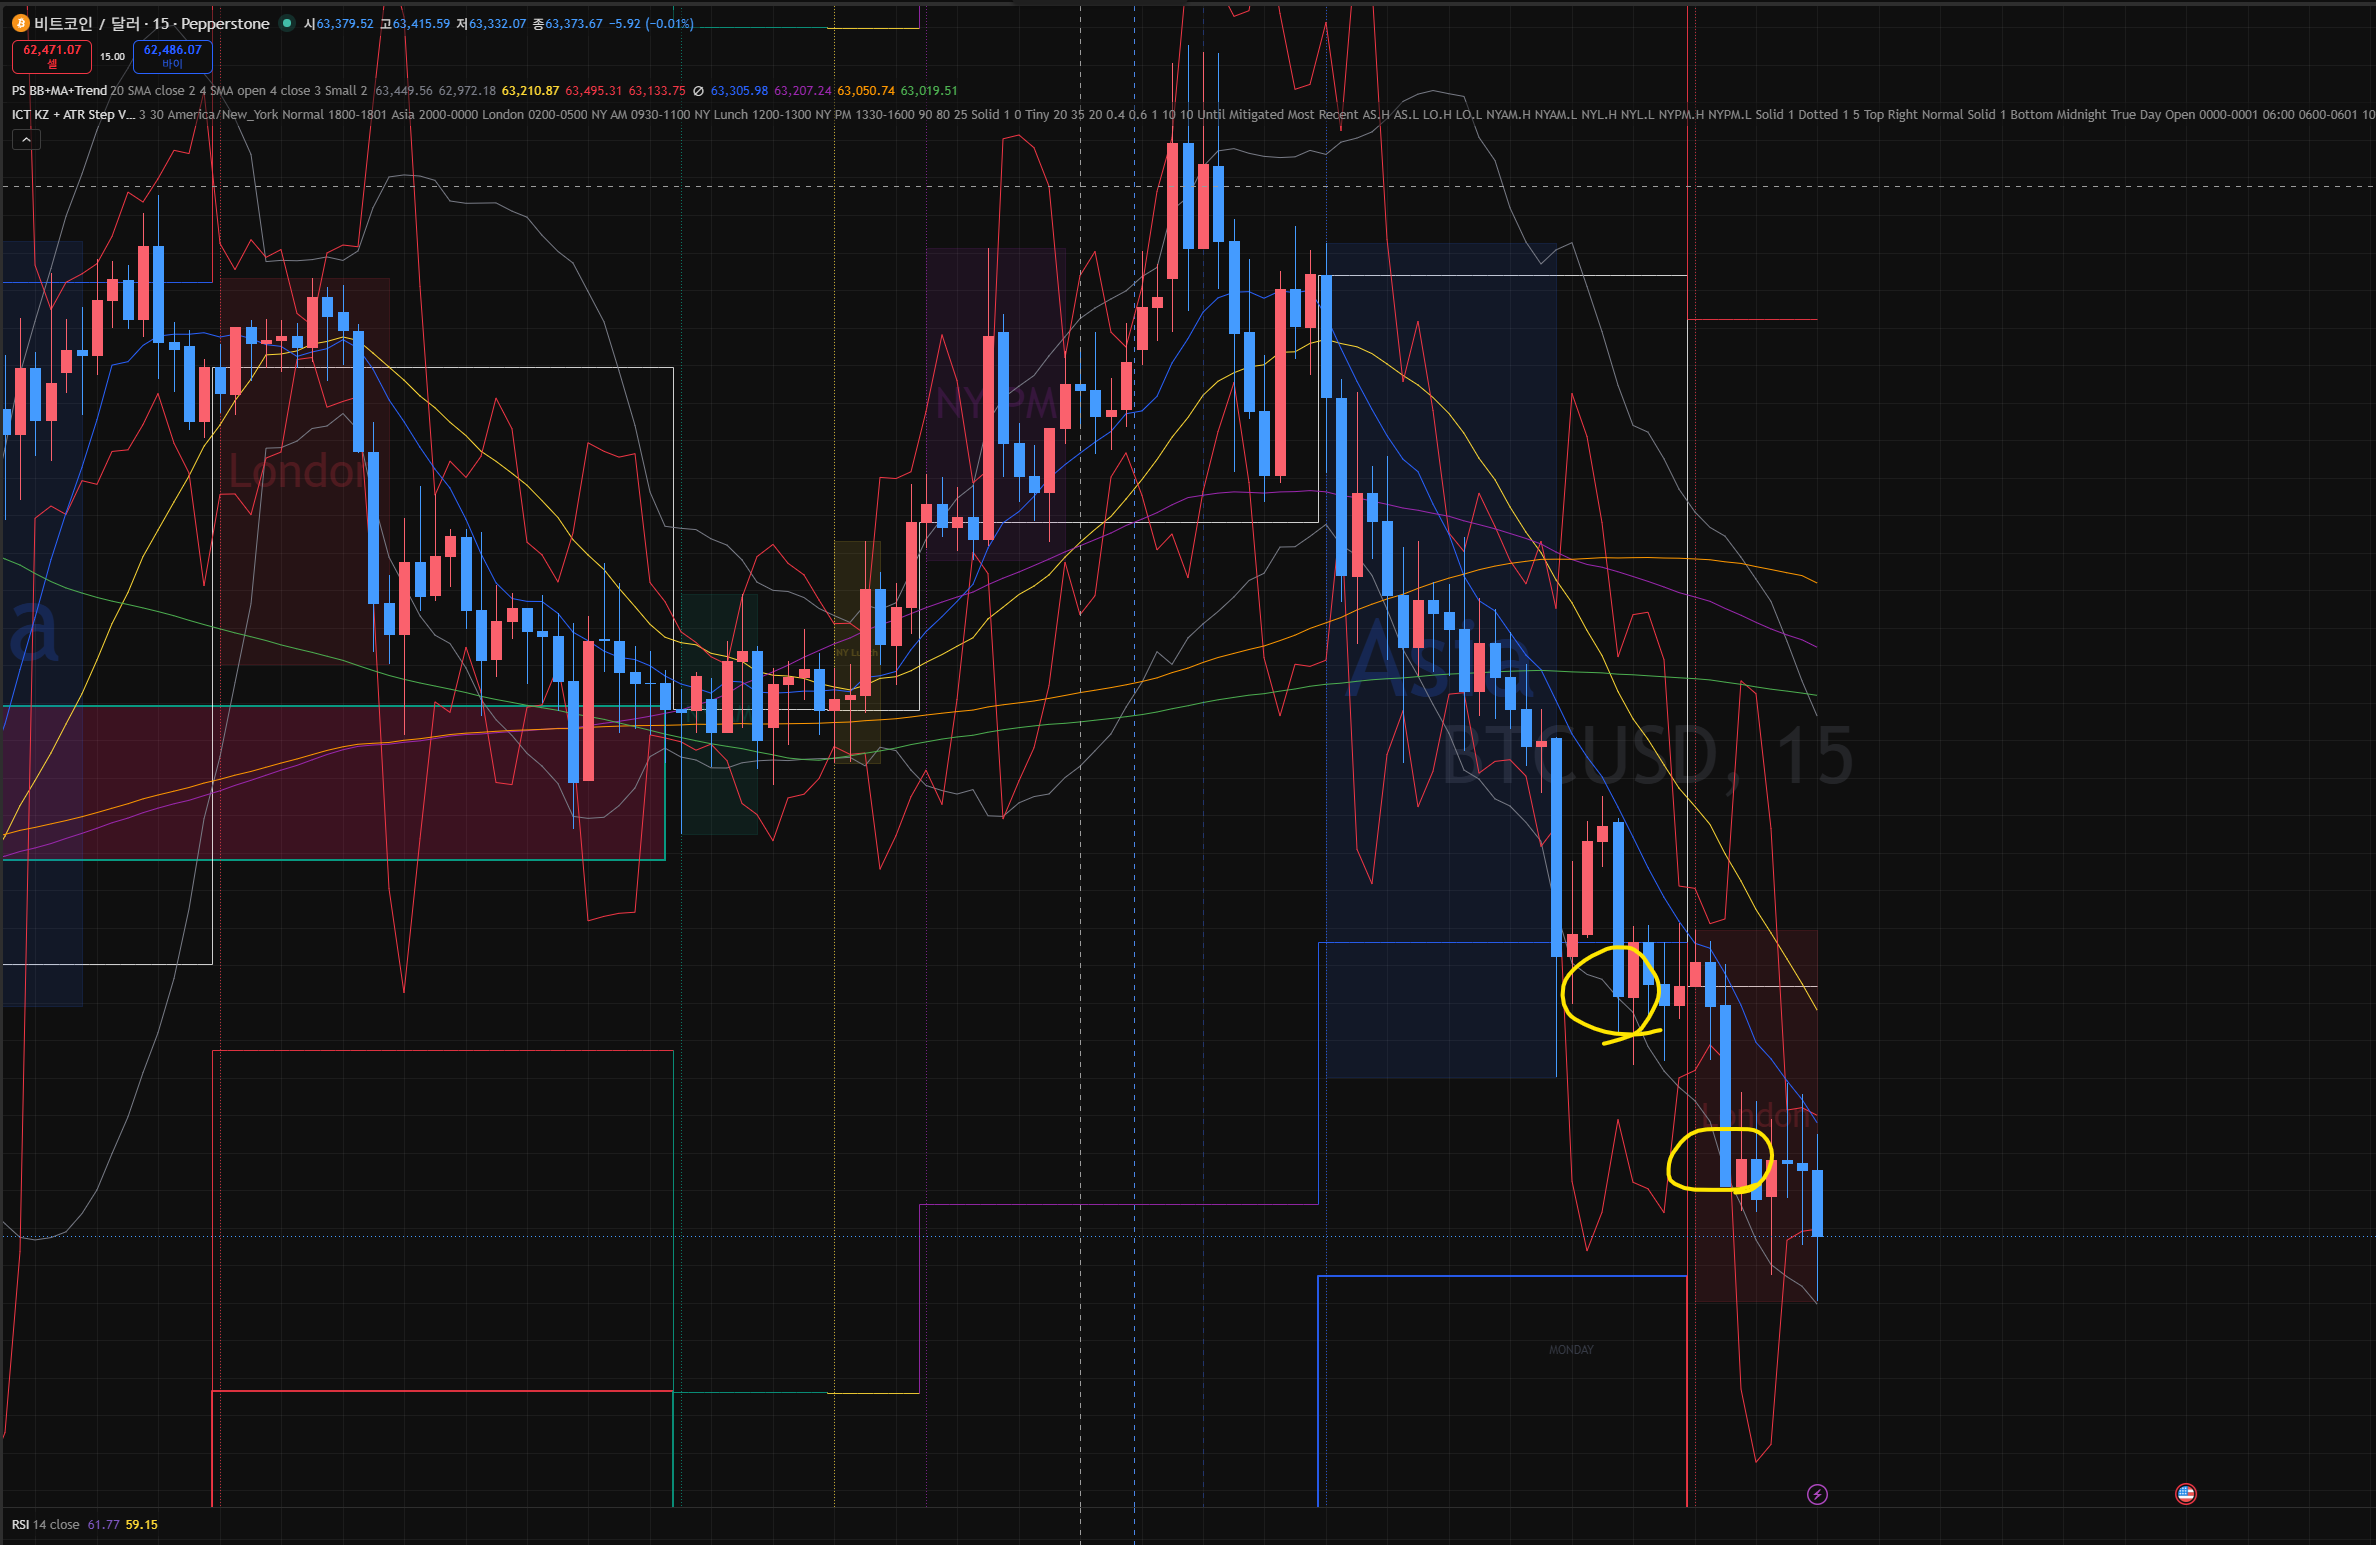
Today I entered Bitcoin based on the lines.
It was a day with a small range, so I entered first at 0.4, and while hesitating over whether to enter the 0.6 zone I thought oh whatever and entered one more.
(Scary....)
I made it after several revisions
and although it is nothing special, I am sharing it with the members of Jusik Handang ㅎㅎ
I also ran the backtest several times after collecting my own candles and storing them in a DB,
and it is a script that went through a fair amount of trial and error.
You may download it, throw it at GPT or an AI, ask for the changes you need, and use it after modification.
Well then, may your investing go well today too

